

is much lesser, leading to extraordinary temperature oscillations (Sánchez-Laulhé
2004).
3.1.5 Climate Trends and Climate Change
The Mediterranean is often referred to as a climate change “hotspot” since it exhibits
larger changes than many other regions of the globe (Giorgi 2006; Giorgi and
Lionello 2008).
Precipitation and temperature in the Mediterranean during the twentieth century
show significant trends. Gauge-based reconstructions, gauge-satellite merged products, and atmospheric reanalyses have indicated a negative precipitation trend for the
Mediterranean in winter in the twentieth century (Giorgi 2002; Mariotti et al. 2002),
although high uncertainties affect the observation records in the early part of the
century. Besides, the extent to which the anthropogenic climate change has contributed to the observed trend is still unknown due to limited knowledge of the
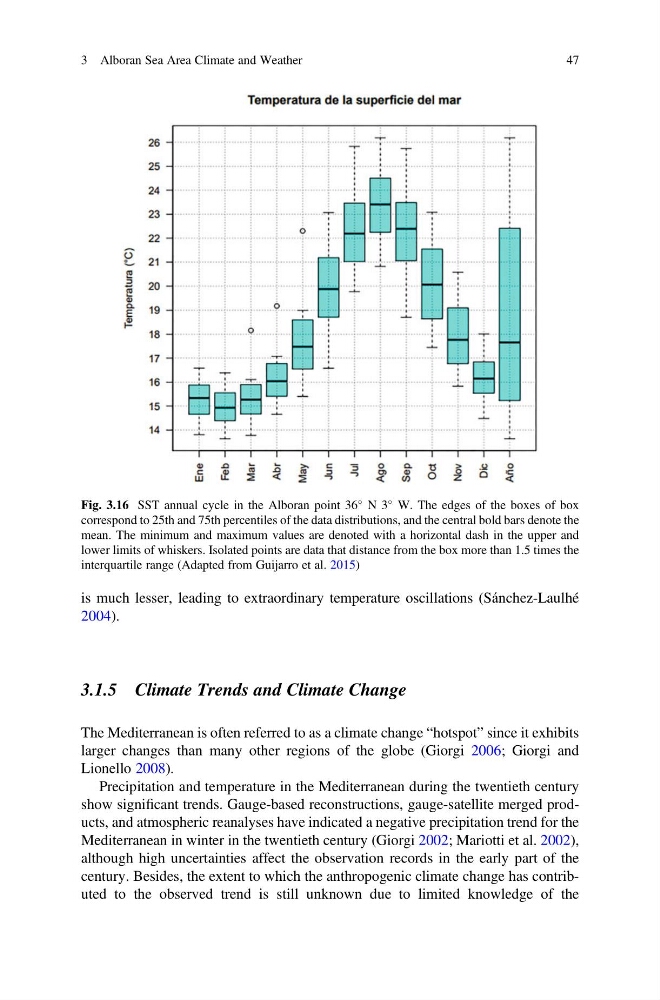
Fig. 3.16 SST annual cycle in the Alboran point 36
N 3
W. The edges of the boxes of box
correspond to 25th and 75th percentiles of the data distributions, and the central bold bars denote the
mean. The minimum and maximum values are denoted with a horizontal dash in the upper and
lower limits of whiskers. Isolated points are data that distance from the box more than 1.5 times the
interquartile range (Adapted from Guijarro et al. 2015)
3 Alboran Sea Area Climate and Weather
47
2004).
3.1.5 Climate Trends and Climate Change
The Mediterranean is often referred to as a climate change “hotspot” since it exhibits
larger changes than many other regions of the globe (Giorgi 2006; Giorgi and
Lionello 2008).
Precipitation and temperature in the Mediterranean during the twentieth century
show significant trends. Gauge-based reconstructions, gauge-satellite merged products, and atmospheric reanalyses have indicated a negative precipitation trend for the
Mediterranean in winter in the twentieth century (Giorgi 2002; Mariotti et al. 2002),
although high uncertainties affect the observation records in the early part of the
century. Besides, the extent to which the anthropogenic climate change has contributed to the observed trend is still unknown due to limited knowledge of the
Fig. 3.16 SST annual cycle in the Alboran point 36
N 3
W. The edges of the boxes of box
correspond to 25th and 75th percentiles of the data distributions, and the central bold bars denote the
mean. The minimum and maximum values are denoted with a horizontal dash in the upper and
lower limits of whiskers. Isolated points are data that distance from the box more than 1.5 times the
interquartile range (Adapted from Guijarro et al. 2015)
3 Alboran Sea Area Climate and Weather
47