

64
2 – Methods and techniques
6. Calculate σ n for a
10
O
WE
12
2
=
−
and σ p for
.
a
1
O
WE
2
=
Data
.
a
268 10
O
RE
4
2
#
=
−
Exercise 2.4 – Measurement of ionic conductivity in a mixed conductor
We now study the ionic conductivity of strontium-doped lanthanum cobaltite
La 0.8 Sr 0.2 CoO 3−δ , (LSCo) at 600 °C as a function of oxygen activity. The ionic
conductivity is measured by using a micro-point made of yttria-stabilized zirconia (YSZ), which is electronically insulating and serves as electrolyte. The
LSCo sample studied in the form of a tablet constitutes the working electrode
(WE). The contact radius (denoted a) between the zirconia and the sample is
0.01 cm. The counter electrode (CE) is a layer of porous platinum deposited
on the face opposite the micro-point. The interface between the micro-point
and the sample is isolated from the gas phase by a tight glass seal. The entire
cell is placed in air, which has an oxygen partial pressure of 0.2 bar. Figure 24
shows a schematic diagram of the setup.
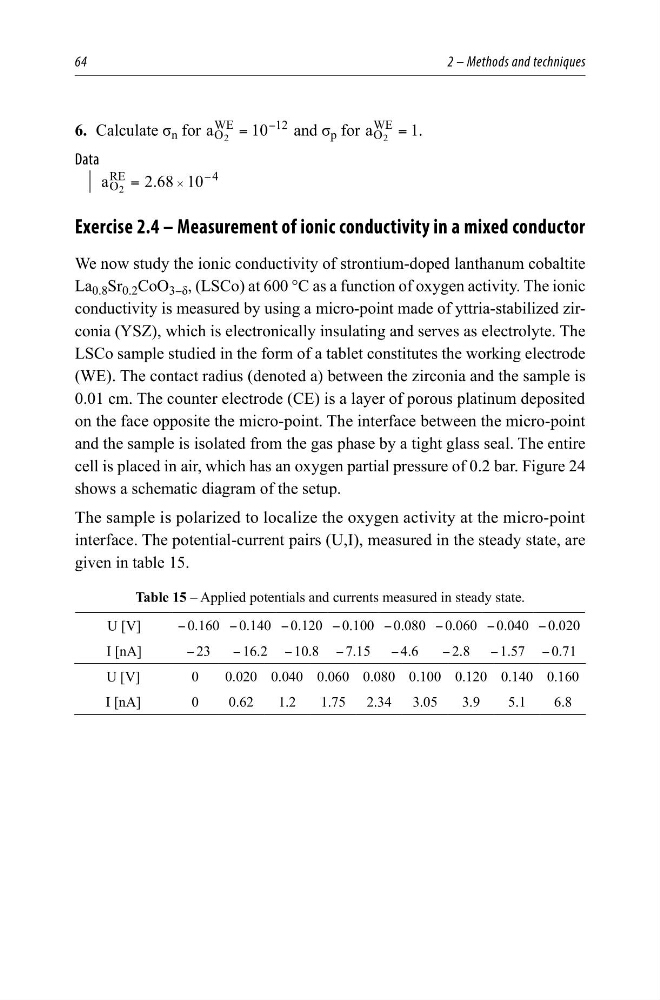
The sample is polarized to localize the oxygen activity at the micro-point
interface. The potential-current pairs (U,I), measured in the steady state, are
given in table 15.
Table 15 – Applied potentials and currents measured in steady state.
U [V]
− 0.160 − 0.140 − 0.120 − 0.100 − 0.080 − 0.060 − 0.040 − 0.020
I [nA]
− 23
− 16.2 − 10.8 − 7.15 − 4.6
− 2.8 − 1.57 − 0.71
U [V]
0
0.020 0.040 0.060 0.080 0.100 0.120 0.140 0.160
I [nA]
0
0.62
1.2
1.75 2.34 3.05
3.9
5.1
6.8
2 – Methods and techniques
6. Calculate σ n for a
10
O
WE
12
2
=
−
and σ p for
.
a
1
O
WE
2
=
Data
.
a
268 10
O
RE
4
2
#
=
−
Exercise 2.4 – Measurement of ionic conductivity in a mixed conductor
We now study the ionic conductivity of strontium-doped lanthanum cobaltite
La 0.8 Sr 0.2 CoO 3−δ , (LSCo) at 600 °C as a function of oxygen activity. The ionic
conductivity is measured by using a micro-point made of yttria-stabilized zirconia (YSZ), which is electronically insulating and serves as electrolyte. The
LSCo sample studied in the form of a tablet constitutes the working electrode
(WE). The contact radius (denoted a) between the zirconia and the sample is
0.01 cm. The counter electrode (CE) is a layer of porous platinum deposited
on the face opposite the micro-point. The interface between the micro-point
and the sample is isolated from the gas phase by a tight glass seal. The entire
cell is placed in air, which has an oxygen partial pressure of 0.2 bar. Figure 24
shows a schematic diagram of the setup.
The sample is polarized to localize the oxygen activity at the micro-point
interface. The potential-current pairs (U,I), measured in the steady state, are
given in table 15.
Table 15 – Applied potentials and currents measured in steady state.
U [V]
− 0.160 − 0.140 − 0.120 − 0.100 − 0.080 − 0.060 − 0.040 − 0.020
I [nA]
− 23
− 16.2 − 10.8 − 7.15 − 4.6
− 2.8 − 1.57 − 0.71
U [V]
0
0.020 0.040 0.060 0.080 0.100 0.120 0.140 0.160
I [nA]
0
0.62
1.2
1.75 2.34 3.05
3.9
5.1
6.8