

62
2 – Methods and techniques
3. From the given data (table 13), calculate
a. the geometric factor k of the sample,
b. the relaxation frequency ω 0 ,
c. the time constant τ 0 ,
d. the capacitance C,
e. the decentering angle β,
f. the dielectric constant ε R ,
g. the permittivity ε,
h. the electrical conductivity σ,
i. the electrical resistivity ρ of the sample.
4. Of these parameters, which are independent of the sample shape?
5. What is the most appropriate equivalent circuit?
Exercise 2.3 – Measurement of electronic conductivity
in a mixed conductor
The electronic conductivity of ceria doped with gadolinium oxide and with
praseodymium oxide (Ce 0.8 Gd 0.17 Pr 0.03 O 1.9 , denoted CGP) is studied at 750 °C
as a function of oxygen activity. The sample is inserted between an O
2−
-ionblocking platinum working electrode (WE) and a reference electrode (RE) to
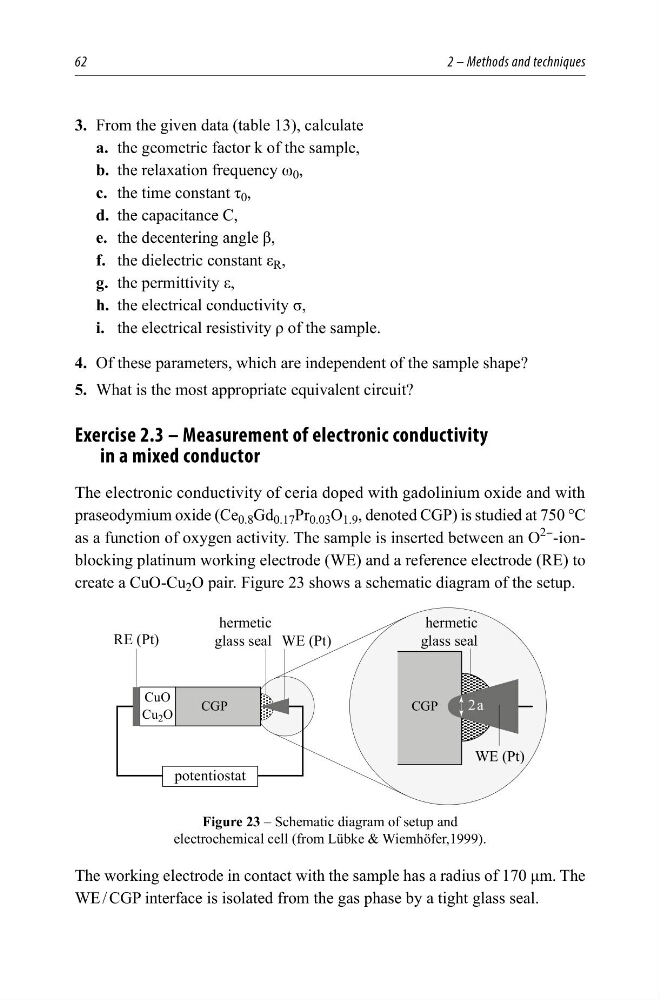
create a CuO-Cu 2 O pair. Figure 23 shows a schematic diagram of the setup.
&X2
&X 2
&*3
5(3W
:(3W
:(3W
KHUPHWLF
JODVVVHDO
KHUPHWLF
JODVVVHDO
&*3
D
SRWHQWLRVWDW
Figure 23 – Schematic diagram of setup and
electrochemical cell (from Lübke & Wiemhöfer,1999).
The working electrode in contact with the sample has a radius of 170 μm. The
WE / CGP interface is isolated from the gas phase by a tight glass seal.
2 – Methods and techniques
3. From the given data (table 13), calculate
a. the geometric factor k of the sample,
b. the relaxation frequency ω 0 ,
c. the time constant τ 0 ,
d. the capacitance C,
e. the decentering angle β,
f. the dielectric constant ε R ,
g. the permittivity ε,
h. the electrical conductivity σ,
i. the electrical resistivity ρ of the sample.
4. Of these parameters, which are independent of the sample shape?
5. What is the most appropriate equivalent circuit?
Exercise 2.3 – Measurement of electronic conductivity
in a mixed conductor
The electronic conductivity of ceria doped with gadolinium oxide and with
praseodymium oxide (Ce 0.8 Gd 0.17 Pr 0.03 O 1.9 , denoted CGP) is studied at 750 °C
as a function of oxygen activity. The sample is inserted between an O
2−
-ionblocking platinum working electrode (WE) and a reference electrode (RE) to
create a CuO-Cu 2 O pair. Figure 23 shows a schematic diagram of the setup.
&X2
&X 2
&*3
5(3W
:(3W
:(3W
KHUPHWLF
JODVVVHDO
KHUPHWLF
JODVVVHDO
&*3
D
SRWHQWLRVWDW
Figure 23 – Schematic diagram of setup and
electrochemical cell (from Lübke & Wiemhöfer,1999).
The working electrode in contact with the sample has a radius of 170 μm. The
WE / CGP interface is isolated from the gas phase by a tight glass seal.