

Course notes
55
where I is the intensity of the electrolysis current, M is the molar mass of MX,
and τ is the electrolysis time.
P
P
P
Pƍ
P
Pƍ
5
K
,
%HIRUHHOHFWURO\VLV
'XULQJHOHFWURO\VLV
$IWHUHOHFWURO\VLV
Figure 16 – Schematic of principle for measuring cationic
transport number by using the Tubandt method (from Hladik, 1972).
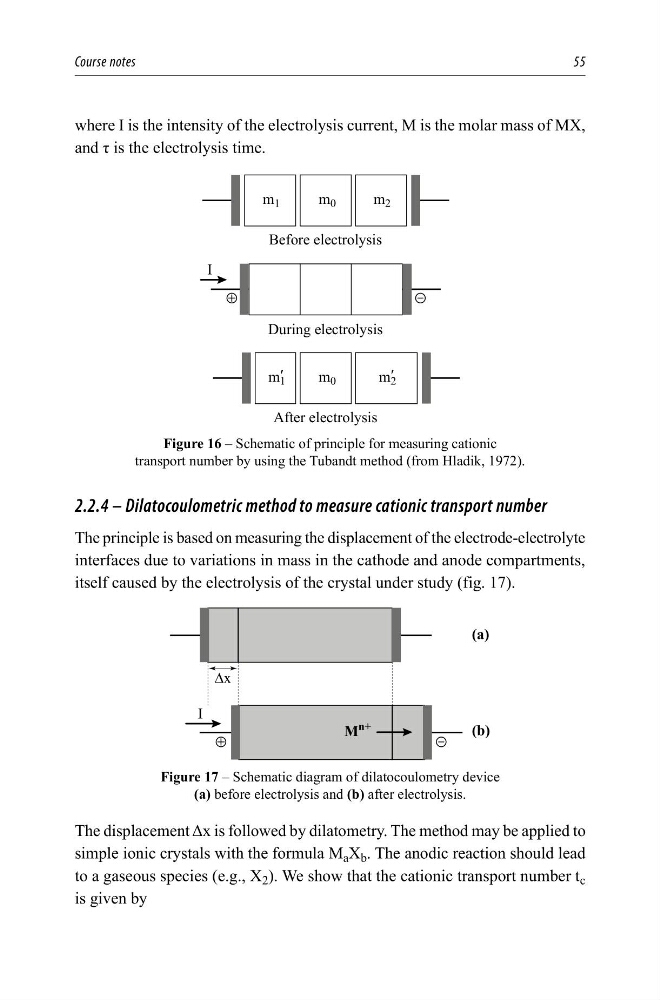
2.2.4 – Dilatocoulometric method to measure cationic transport number
The principle is based on measuring the displacement of the electrode-electrolyte
interfaces due to variations in mass in the cathode and anode compartments,
itself caused by the electrolysis of the crystal under study (fig. 17).
5
K
0
Q
D
E
¨[
,
Figure 17 – Schematic diagram of dilatocoulometry device
(a) before electrolysis and (b) after electrolysis.
The displacement Δx is followed by dilatometry. The method may be applied to
simple ionic crystals with the formula M a X b . The anodic reaction should lead
to a gaseous species (e.g., X 2 ). We show that the cationic transport number t c
is given by
55
where I is the intensity of the electrolysis current, M is the molar mass of MX,
and τ is the electrolysis time.
P
P
P
Pƍ
P
Pƍ
5
K
,
%HIRUHHOHFWURO\VLV
'XULQJHOHFWURO\VLV
$IWHUHOHFWURO\VLV
Figure 16 – Schematic of principle for measuring cationic
transport number by using the Tubandt method (from Hladik, 1972).
2.2.4 – Dilatocoulometric method to measure cationic transport number
The principle is based on measuring the displacement of the electrode-electrolyte
interfaces due to variations in mass in the cathode and anode compartments,
itself caused by the electrolysis of the crystal under study (fig. 17).
5
K
0
Q
D
E
¨[
,
Figure 17 – Schematic diagram of dilatocoulometry device
(a) before electrolysis and (b) after electrolysis.
The displacement Δx is followed by dilatometry. The method may be applied to
simple ionic crystals with the formula M a X b . The anodic reaction should lead
to a gaseous species (e.g., X 2 ). We show that the cationic transport number t c
is given by