

50
2 – Methods and techniques
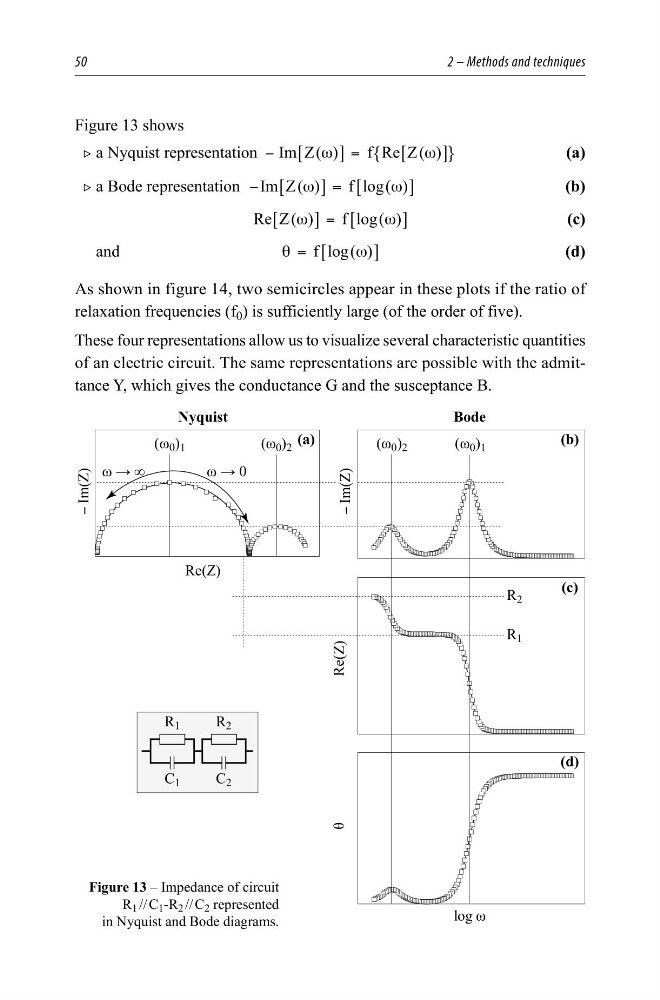
Figure 13 shows
2 a Nyquist representation
( )
( )
Im
Re
Z
f
Z
ω
ω
−
=
6
6
@
@
"
,
(a)
2 a Bode representation
( )
( )
Im
log
Z
f
ω
ω
−
=
6
6
@
@
(b)
( )
( )
Re
log
Z
f
ω
ω
=
6
6
@
@
(c)
and
( )
log
f
θ
ω
= 6
@
(d)
As shown in figure 14, two semicircles appear in these plots if the ratio of
relaxation frequencies (f 0 ) is sufficiently large (of the order of five).
These four representations allow us to visualize several characteristic quantities
of an electric circuit. The same representations are possible with the admittance Y, which gives the conductance G and the susceptance B.
Figure 13 – Impedance of circuit
R 1 // C 1 -R 2 // C 2 represented
in Nyquist and Bode diagrams.
ORJȦ
Ȧĺ
Ȧ
Ȧ
Ȧ
Ȧ
Ȧĺ
5H=
5H=
ș
<
,P=
<
,P=
1\TXLVW
%RGH
D
E
F
G
5
5
5
5
&
&
2 – Methods and techniques
Figure 13 shows
2 a Nyquist representation
( )
( )
Im
Re
Z
f
Z
ω
ω
−
=
6
6
@
@
"
,
(a)
2 a Bode representation
( )
( )
Im
log
Z
f
ω
ω
−
=
6
6
@
@
(b)
( )
( )
Re
log
Z
f
ω
ω
=
6
6
@
@
(c)
and
( )
log
f
θ
ω
= 6
@
(d)
As shown in figure 14, two semicircles appear in these plots if the ratio of
relaxation frequencies (f 0 ) is sufficiently large (of the order of five).
These four representations allow us to visualize several characteristic quantities
of an electric circuit. The same representations are possible with the admittance Y, which gives the conductance G and the susceptance B.
Figure 13 – Impedance of circuit
R 1 // C 1 -R 2 // C 2 represented
in Nyquist and Bode diagrams.
ORJȦ
Ȧĺ
Ȧ
Ȧ
Ȧ
Ȧ
Ȧĺ
5H=
5H=
ș
<
,P=
<
,P=
1\TXLVW
%RGH
D
E
F
G
5
5
5
5
&
&