

Course notes
49
Similarly, k R //C circuits connected in series have a total impedance
Z ( )
1 R C
R
j
1 R C
R C
(RC)
k
2 k
2 2
k
k
k
2 k
2 2
k
2 k
k
k
ω
ω
ω
ω
=
+
−
+
;
=
E
G
/
/
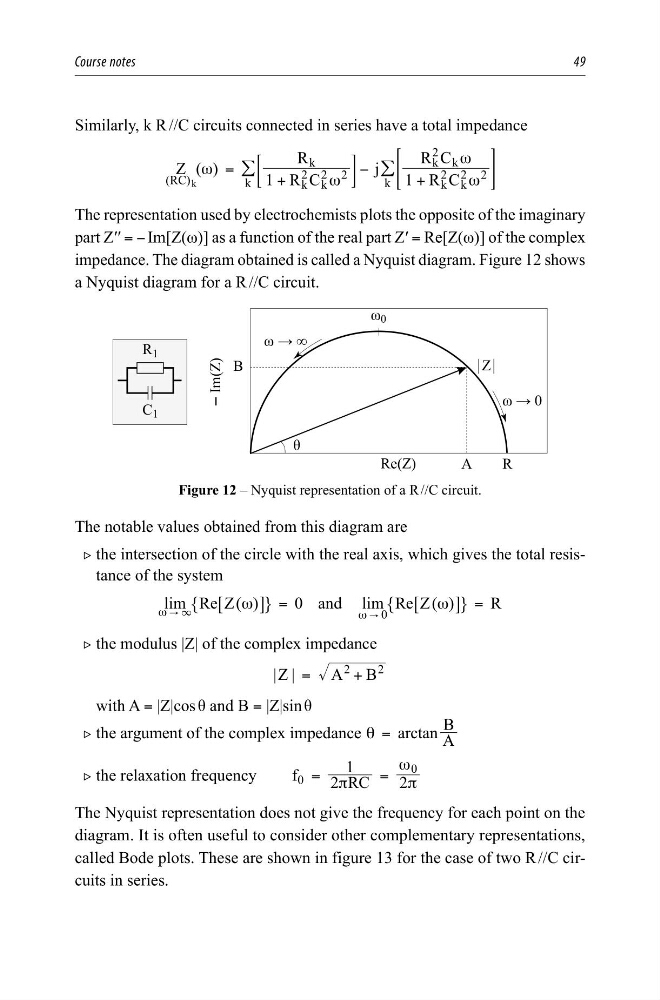
The representation used by electrochemists plots the opposite of the imaginary
part Z′′ = − Im[Z(ω)] as a function of the real part Z′ = Re[Z(ω)] of the complex
impedance. The diagram obtained is called a Nyquist diagram. Figure 12 shows
a Nyquist diagram for a R //C circuit.
<
,P=
5H=
_=_
Ȧĺ
Ȧĺ
ș
Ȧ
%
$
5
5
&
Figure 12 – Nyquist representation of a R //C circuit.
The notable values obtained from this diagram are
2 the intersection of the circle with the real axis, which gives the total resistance of the system
lim Re Z( )
0 and lim Re Z( )
R
0
ω
ω
=
=
"
"
3
ω
ω
6
6
@
@
"
"
,
,
2 the modulus |Z| of the complex impedance
| |
Z
A B
2
2
=
+
with A = |Z|cos θ and B = |Z|sin θ
2 the argument of the complex impedance
arctan A
B
θ =
2 the relaxation frequency
2
1
2
f
RC
0
0
π
π
ω
=
=
The Nyquist representation does not give the frequency for each point on the
diagram. It is often useful to consider other complementary representations,
called Bode plots. These are shown in figure 13 for the case of two R //C circuits in series.
49
Similarly, k R //C circuits connected in series have a total impedance
Z ( )
1 R C
R
j
1 R C
R C
(RC)
k
2 k
2 2
k
k
k
2 k
2 2
k
2 k
k
k
ω
ω
ω
ω
=
+
−
+
;
=
E
G
/
/
The representation used by electrochemists plots the opposite of the imaginary
part Z′′ = − Im[Z(ω)] as a function of the real part Z′ = Re[Z(ω)] of the complex
impedance. The diagram obtained is called a Nyquist diagram. Figure 12 shows
a Nyquist diagram for a R //C circuit.
<
,P=
5H=
_=_
Ȧĺ
Ȧĺ
ș
Ȧ
%
$
5
5
&
Figure 12 – Nyquist representation of a R //C circuit.
The notable values obtained from this diagram are
2 the intersection of the circle with the real axis, which gives the total resistance of the system
lim Re Z( )
0 and lim Re Z( )
R
0
ω
ω
=
=
"
"
3
ω
ω
6
6
@
@
"
"
,
,
2 the modulus |Z| of the complex impedance
| |
Z
A B
2
2
=
+
with A = |Z|cos θ and B = |Z|sin θ
2 the argument of the complex impedance
arctan A
B
θ =
2 the relaxation frequency
2
1
2
f
RC
0
0
π
π
ω
=
=
The Nyquist representation does not give the frequency for each point on the
diagram. It is often useful to consider other complementary representations,
called Bode plots. These are shown in figure 13 for the case of two R //C circuits in series.