

Course notes
11
notation for the reaction highlights the role of the defects corresponding to the
dominant atomic disorder in the crystal. For example, consider the reaction
in which MX (M
+ , X
−
) is doped with DX 2 (D
2+
, 2X
−
), given that Schottky
disorder dominates in MX and D substitutes for M. The reaction is written as
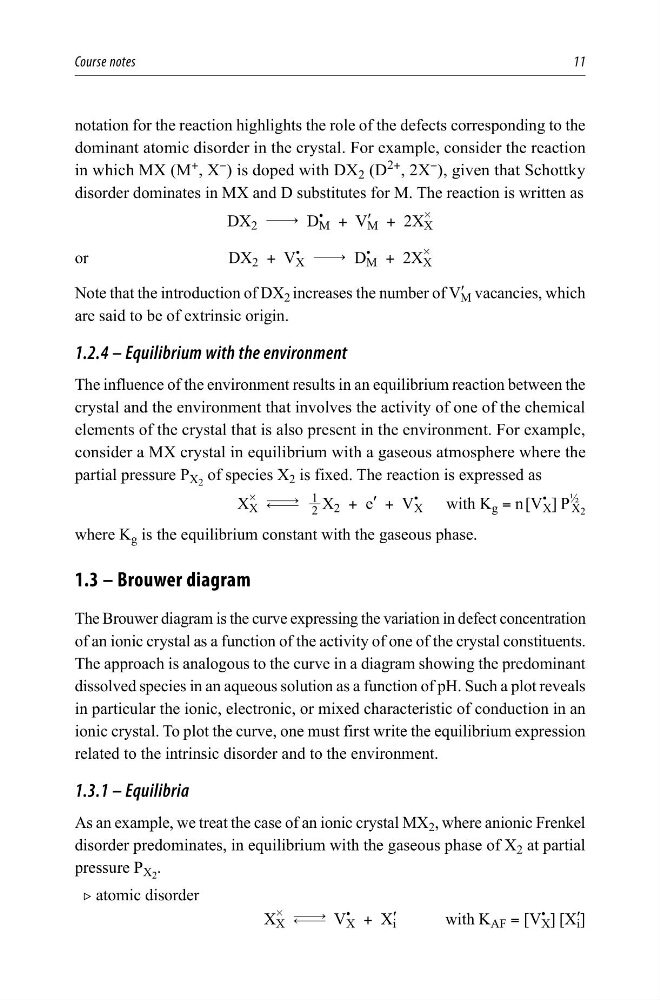
DX 2 $ D
•
M + V ′
M + 2X
#
X
or
DX 2 + V
•
X $ D
•
M + 2X
#
X
Note that the introduction of DX 2 increases the number of V ′
M vacancies, which
are said to be of extrinsic origin.
1.2.4 – Equilibrium with the environment
The influence of the environment results in an equilibrium reaction between the
crystal and the environment that involves the activity of one of the chemical
elements of the crystal that is also present in the environment. For example,
consider a MX crystal in equilibrium with a gaseous atmosphere where the
partial pressure P X 2 of species X 2 is fixed. The reaction is expressed as
X
#
X m 2
1
X 2 + e ′ + V
•
X
with K g = n [V
•
X ] P
½
X 2
where K g is the equilibrium constant with the gaseous phase.
1.3 – Brouwer diagram
The Brouwer diagram is the curve expressing the variation in defect concentration
of an ionic crystal as a function of the activity of one of the crystal constituents.
The approach is analogous to the curve in a diagram showing the predominant
dissolved species in an aqueous solution as a function of pH. Such a plot reveals
in particular the ionic, electronic, or mixed characteristic of conduction in an
ionic crystal. To plot the curve, one must first write the equilibrium expression
related to the intrinsic disorder and to the environment.
1.3.1 – Equilibria
As an example, we treat the case of an ionic crystal MX 2 , where anionic Frenkel
disorder predominates, in equilibrium with the gaseous phase of X 2 at partial
pressure P X 2 .
2 atomic disorder
X
#
X m V
•
X + X ′
i
with K AF = [V
•
X ] [X ′
i ]
11
notation for the reaction highlights the role of the defects corresponding to the
dominant atomic disorder in the crystal. For example, consider the reaction
in which MX (M
+ , X
−
) is doped with DX 2 (D
2+
, 2X
−
), given that Schottky
disorder dominates in MX and D substitutes for M. The reaction is written as
DX 2 $ D
•
M + V ′
M + 2X
#
X
or
DX 2 + V
•
X $ D
•
M + 2X
#
X
Note that the introduction of DX 2 increases the number of V ′
M vacancies, which
are said to be of extrinsic origin.
1.2.4 – Equilibrium with the environment
The influence of the environment results in an equilibrium reaction between the
crystal and the environment that involves the activity of one of the chemical
elements of the crystal that is also present in the environment. For example,
consider a MX crystal in equilibrium with a gaseous atmosphere where the
partial pressure P X 2 of species X 2 is fixed. The reaction is expressed as
X
#
X m 2
1
X 2 + e ′ + V
•
X
with K g = n [V
•
X ] P
½
X 2
where K g is the equilibrium constant with the gaseous phase.
1.3 – Brouwer diagram
The Brouwer diagram is the curve expressing the variation in defect concentration
of an ionic crystal as a function of the activity of one of the crystal constituents.
The approach is analogous to the curve in a diagram showing the predominant
dissolved species in an aqueous solution as a function of pH. Such a plot reveals
in particular the ionic, electronic, or mixed characteristic of conduction in an
ionic crystal. To plot the curve, one must first write the equilibrium expression
related to the intrinsic disorder and to the environment.
1.3.1 – Equilibria
As an example, we treat the case of an ionic crystal MX 2 , where anionic Frenkel
disorder predominates, in equilibrium with the gaseous phase of X 2 at partial
pressure P X 2 .
2 atomic disorder
X
#
X m V
•
X + X ′
i
with K AF = [V
•
X ] [X ′
i ]