

Exercises
229
Table 50 – Limiting current as a function of temperature
for a molar fraction of oxygen of 0.9 and1 bar total pressure.
Temperature [°C]
400
500
600
700
Limiting current [μA]
974
1 073
1 169
1 282
Based on the data of table 50,
a. plot the curve representing the limiting current as a function of temperature.
b. Deduce the expression for the function I ℓ = f (T).
6. Describe the shape of the curve for the case of a gaseous mixture containing
oxygen and water vapor.
7. What technological improvement have we brought to a hole-based sensor?
Exercise 5.12 – Coulometric oxygen sensor
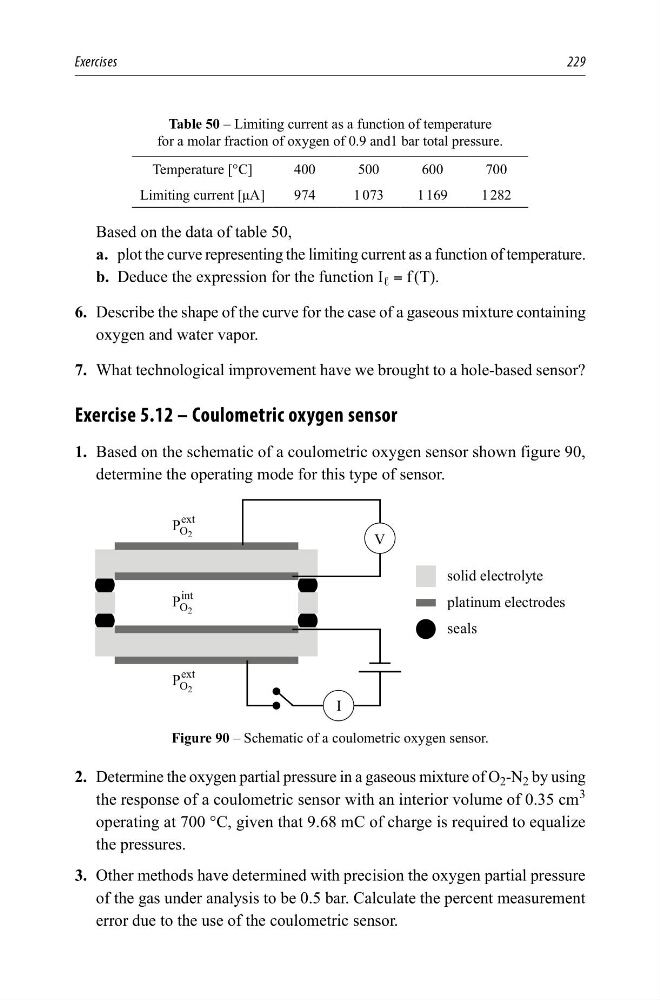
1. Based on the schematic of a coulometric oxygen sensor shown figure 90,
determine the operating mode for this type of sensor.
VROLGHOHFWURO\WH
SODWLQXPHOHFWURGHV
VHDOV
9
,
H[W
3
2
LQW
3
2
H[W
3
2
Figure 90 – Schematic of a coulometric oxygen sensor.
2. Determine the oxygen partial pressure in a gaseous mixture of O 2 -N 2 by using
the response of a coulometric sensor with an interior volume of 0.35 cm
3
operating at 700 °C, given that 9.68 mC of charge is required to equalize
the pressures.
3. Other methods have determined with precision the oxygen partial pressure
of the gas under analysis to be 0.5 bar. Calculate the percent measurement
error due to the use of the coulometric sensor.
229
Table 50 – Limiting current as a function of temperature
for a molar fraction of oxygen of 0.9 and1 bar total pressure.
Temperature [°C]
400
500
600
700
Limiting current [μA]
974
1 073
1 169
1 282
Based on the data of table 50,
a. plot the curve representing the limiting current as a function of temperature.
b. Deduce the expression for the function I ℓ = f (T).
6. Describe the shape of the curve for the case of a gaseous mixture containing
oxygen and water vapor.
7. What technological improvement have we brought to a hole-based sensor?
Exercise 5.12 – Coulometric oxygen sensor
1. Based on the schematic of a coulometric oxygen sensor shown figure 90,
determine the operating mode for this type of sensor.
VROLGHOHFWURO\WH
SODWLQXPHOHFWURGHV
VHDOV
9
,
H[W
3
2
LQW
3
2
H[W
3
2
Figure 90 – Schematic of a coulometric oxygen sensor.
2. Determine the oxygen partial pressure in a gaseous mixture of O 2 -N 2 by using
the response of a coulometric sensor with an interior volume of 0.35 cm
3
operating at 700 °C, given that 9.68 mC of charge is required to equalize
the pressures.
3. Other methods have determined with precision the oxygen partial pressure
of the gas under analysis to be 0.5 bar. Calculate the percent measurement
error due to the use of the coulometric sensor.