

Exercises
181
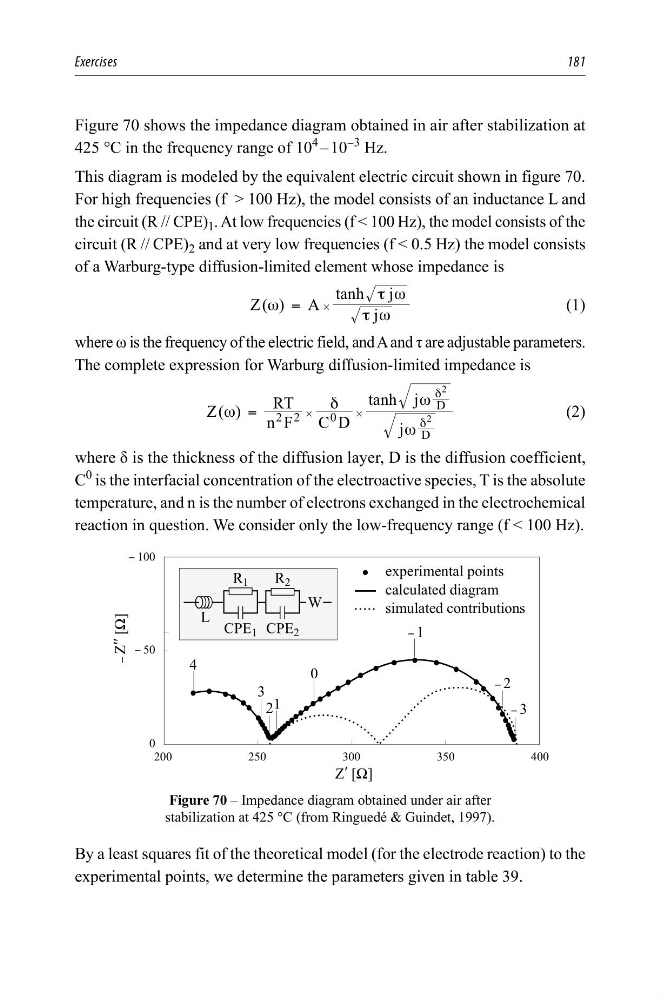
Figure 70 shows the impedance diagram obtained in air after stabilization at
425 °C in the frequency range of 10
4
– 10
−3
Hz.
This diagram is modeled by the equivalent electric circuit shown in figure 70.
For high frequencies (f > 100 Hz), the model consists of an inductance L and
the circuit (R // CPE) 1 . At low frequencies (f < 100 Hz), the model consists of the
circuit (R // CPE) 2 and at very low frequencies (f < 0.5 Hz) the model consists
of a Warburg-type diffusion-limited element whose impedance is
Z( ) A
j
tanh j
ω
τ ω
τ ω
= #
(1)
where ω is the frequency of the electric field, and A and τ are adjustable parameters.
The complete expression for Warburg diffusion-limited impedance is
Z( )
n F
RT
C D
j
tanh j
2 2
0
D
D
2
2
ω
δ
ω
ω
=
δ
δ
#
#
(2)
where δ is the thickness of the diffusion layer, D is the diffusion coefficient,
C
0
is the interfacial concentration of the electroactive species, T is the absolute
temperature, and n is the number of electrons exchanged in the electrochemical
reaction in question. We consider only the low-frequency range (f < 100 Hz).
<
<
H[SHULPHQWDOSRLQWV
FDOFXODWHGGLDJUDP
VLPXODWHGFRQWULEXWLRQV
=ƍ>@
<=ƍƍ>@
:
5
5
&3( &3(
/
<
<
<
Figure 70 – Impedance diagram obtained under air after
stabilization at 425 °C (from Ringuedé & Guindet, 1997).
By a least squares fit of the theoretical model (for the electrode reaction) to the
experimental points, we determine the parameters given in table 39.
181
Figure 70 shows the impedance diagram obtained in air after stabilization at
425 °C in the frequency range of 10
4
– 10
−3
Hz.
This diagram is modeled by the equivalent electric circuit shown in figure 70.
For high frequencies (f > 100 Hz), the model consists of an inductance L and
the circuit (R // CPE) 1 . At low frequencies (f < 100 Hz), the model consists of the
circuit (R // CPE) 2 and at very low frequencies (f < 0.5 Hz) the model consists
of a Warburg-type diffusion-limited element whose impedance is
Z( ) A
j
tanh j
ω
τ ω
τ ω
= #
(1)
where ω is the frequency of the electric field, and A and τ are adjustable parameters.
The complete expression for Warburg diffusion-limited impedance is
Z( )
n F
RT
C D
j
tanh j
2 2
0
D
D
2
2
ω
δ
ω
ω
=
δ
δ
#
#
(2)
where δ is the thickness of the diffusion layer, D is the diffusion coefficient,
C
0
is the interfacial concentration of the electroactive species, T is the absolute
temperature, and n is the number of electrons exchanged in the electrochemical
reaction in question. We consider only the low-frequency range (f < 100 Hz).
<
<
H[SHULPHQWDOSRLQWV
FDOFXODWHGGLDJUDP
VLPXODWHGFRQWULEXWLRQV
=ƍ>@
<=ƍƍ>@
:
5
5
&3( &3(
/
<
<
<
Figure 70 – Impedance diagram obtained under air after
stabilization at 425 °C (from Ringuedé & Guindet, 1997).
By a least squares fit of the theoretical model (for the electrode reaction) to the
experimental points, we determine the parameters given in table 39.