

Solutions to exercises
161
T
4
3
757
0 = #
T
K
568
0 =
A least squares refinement of the parameters A 2 and B 2 in the nonlinear range gives the best fit between the experimental points
and theory
T A e
2
R(T T )
B
0
2
σ
=
+
−
−
• The parameters obtained for the high-temperature part are
.
A
S cm K
4 17 10
2
3
1
#
=
−
.
B
k J mol
12 34
2
1
=
−
• The equation for the product σ + T is
T 4.17 10 e
3
R(T 568)
12 340
#
σ
=
+
−
−
• The experimental function log T f T
1
σ =
+
^ hx and the equations
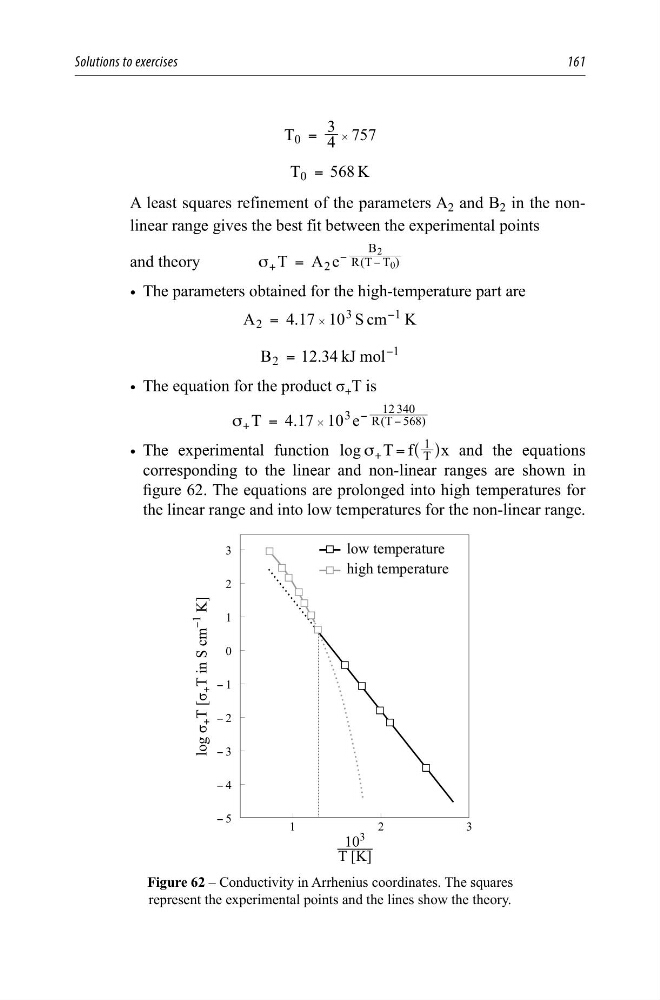
corresponding to the linear and non-linear ranges are shown in
figure 62. The equations are prolonged into high temperatures for
the linear range and into low temperatures for the non-linear range.
KLJKWHPSHUDWXUH
ORZWHPSHUDWXUH
<
<
<
<
<
—
7>.@
ORJı
7>ı
7LQ6FP
<
.@
Figure 62 – Conductivity in Arrhenius coordinates. The squares
represent the experimental points and the lines show the theory.
161
T
4
3
757
0 = #
T
K
568
0 =
A least squares refinement of the parameters A 2 and B 2 in the nonlinear range gives the best fit between the experimental points
and theory
T A e
2
R(T T )
B
0
2
σ
=
+
−
−
• The parameters obtained for the high-temperature part are
.
A
S cm K
4 17 10
2
3
1
#
=
−
.
B
k J mol
12 34
2
1
=
−
• The equation for the product σ + T is
T 4.17 10 e
3
R(T 568)
12 340
#
σ
=
+
−
−
• The experimental function log T f T
1
σ =
+
^ hx and the equations
corresponding to the linear and non-linear ranges are shown in
figure 62. The equations are prolonged into high temperatures for
the linear range and into low temperatures for the non-linear range.
KLJKWHPSHUDWXUH
ORZWHPSHUDWXUH
<
<
<
<
<
—
7>.@
ORJı
7>ı
7LQ6FP
<
.@
Figure 62 – Conductivity in Arrhenius coordinates. The squares
represent the experimental points and the lines show the theory.