

Solutions to exercises
127
Numerical evaluation gives
R
k
76.594 10
1
3
#
σ =
=
1.3 10 S cm
5
1
#
σ =
−
−
4. The circular arc recorded at low frequencies is representative of a surface
phenomenon. In this case it is the reaction at the electrode involving the
oxygen partial pressure and can be written in the form
2
1
O 2(g) + 2e ′ + V
••
O m O
#
O
Solution 3.2 – Study of oxygen mobility in solid solutions
(ThO 2 ) 1−x (YO 1.5 ) x
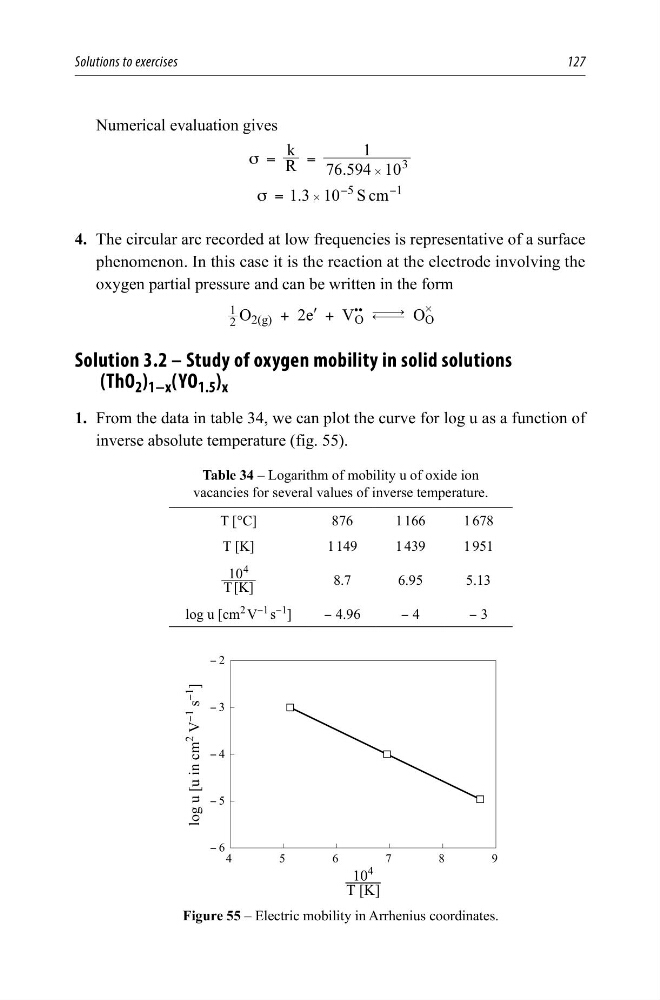
1. From the data in table 34, we can plot the curve for log u as a function of
inverse absolute temperature (fig. 55).
Table 34 – Logarithm of mobility u of oxide ion
vacancies for several values of inverse temperature.
T [°C]
876
1 166
1 678
T [K]
1 149
1 439
1 951
[ ]
T K
10
4
8.7
6.95
5.13
log u [cm
2
V
−1
s
−1
]
− 4.96
− 4
− 3
<
<
<
<
<
ORJX>XLQFP
9
<
V
<
@
—
7>.@
Figure 55 – Electric mobility in Arrhenius coordinates.
127
Numerical evaluation gives
R
k
76.594 10
1
3
#
σ =
=
1.3 10 S cm
5
1
#
σ =
−
−
4. The circular arc recorded at low frequencies is representative of a surface
phenomenon. In this case it is the reaction at the electrode involving the
oxygen partial pressure and can be written in the form
2
1
O 2(g) + 2e ′ + V
••
O m O
#
O
Solution 3.2 – Study of oxygen mobility in solid solutions
(ThO 2 ) 1−x (YO 1.5 ) x
1. From the data in table 34, we can plot the curve for log u as a function of
inverse absolute temperature (fig. 55).
Table 34 – Logarithm of mobility u of oxide ion
vacancies for several values of inverse temperature.
T [°C]
876
1 166
1 678
T [K]
1 149
1 439
1 951
[ ]
T K
10
4
8.7
6.95
5.13
log u [cm
2
V
−1
s
−1
]
− 4.96
− 4
− 3
<
<
<
<
<
ORJX>XLQFP
9
<
V
<
@
—
7>.@
Figure 55 – Electric mobility in Arrhenius coordinates.