

Exercises
Exercise 3.1 – Influence of geometric factor
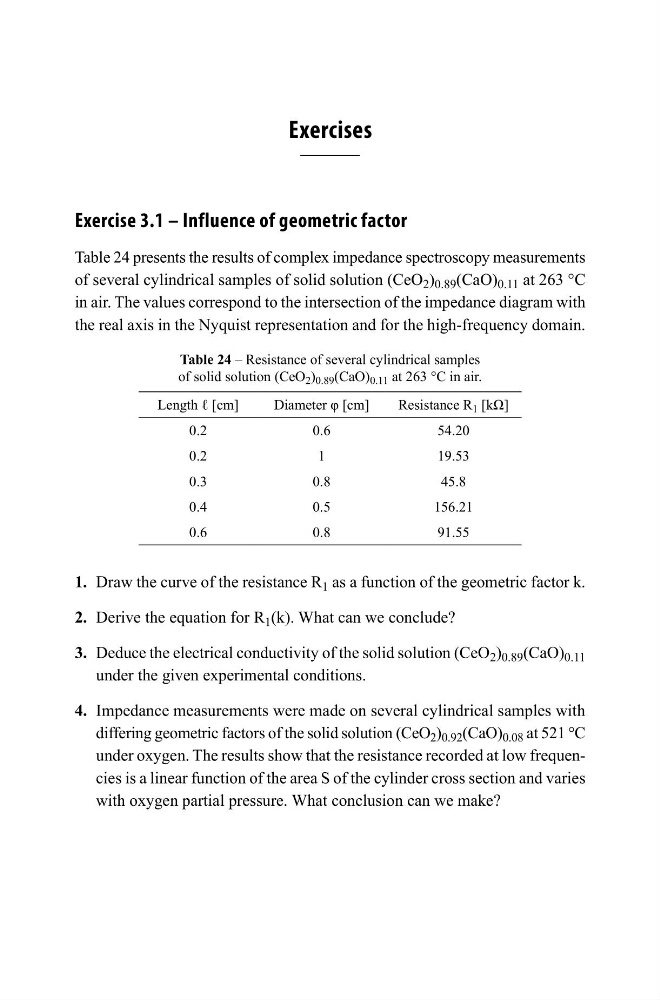
Table 24 presents the results of complex impedance spectroscopy measurements
of several cylindrical samples of solid solution (CeO 2 ) 0.89 (CaO) 0.11 at 263 °C
in air. The values correspond to the intersection of the impedance diagram with
the real axis in the Nyquist representation and for the high-frequency domain.
Table 24 – Resistance of several cylindrical samples
of solid solution (CeO 2 ) 0.89 (CaO) 0.11 at 263 °C in air.
Length ℓ [cm]
Diameter φ [cm]
Resistance R 1 [kΩ]
0.2
0.6
54.20
0.2
1
19.53
0.3
0.8
45.8
0.4
0.5
156.21
0.6
0.8
91.55
1. Draw the curve of the resistance R 1 as a function of the geometric factor k.
2. Derive the equation for R 1 (k). What can we conclude?
3. Deduce the electrical conductivity of the solid solution (CeO 2 ) 0.89 (CaO) 0.11
under the given experimental conditions.
4. Impedance measurements were made on several cylindrical samples with
differing geometric factors of the solid solution (CeO 2 ) 0.92 (CaO) 0.08 at 521 °C
under oxygen. The results show that the resistance recorded at low frequencies is a linear function of the area S of the cylinder cross section and varies
with oxygen partial pressure. What conclusion can we make?
Exercise 3.1 – Influence of geometric factor
Table 24 presents the results of complex impedance spectroscopy measurements
of several cylindrical samples of solid solution (CeO 2 ) 0.89 (CaO) 0.11 at 263 °C
in air. The values correspond to the intersection of the impedance diagram with
the real axis in the Nyquist representation and for the high-frequency domain.
Table 24 – Resistance of several cylindrical samples
of solid solution (CeO 2 ) 0.89 (CaO) 0.11 at 263 °C in air.
Length ℓ [cm]
Diameter φ [cm]
Resistance R 1 [kΩ]
0.2
0.6
54.20
0.2
1
19.53
0.3
0.8
45.8
0.4
0.5
156.21
0.6
0.8
91.55
1. Draw the curve of the resistance R 1 as a function of the geometric factor k.
2. Derive the equation for R 1 (k). What can we conclude?
3. Deduce the electrical conductivity of the solid solution (CeO 2 ) 0.89 (CaO) 0.11
under the given experimental conditions.
4. Impedance measurements were made on several cylindrical samples with
differing geometric factors of the solid solution (CeO 2 ) 0.92 (CaO) 0.08 at 521 °C
under oxygen. The results show that the resistance recorded at low frequencies is a linear function of the area S of the cylinder cross section and varies
with oxygen partial pressure. What conclusion can we make?