

Course notes
99
L Case of high doping level (> 1 %)
This concerns essentially solid oxide solutions that are susceptible of being used
as solid electrolytes in electrochemical generators or in gas sensors. We can cite
as examples ZrO 2 -Y 2 O 3 , CeO 2 -Gd 2 O 3 , and ThO 2 -CaO. These electrolytes are
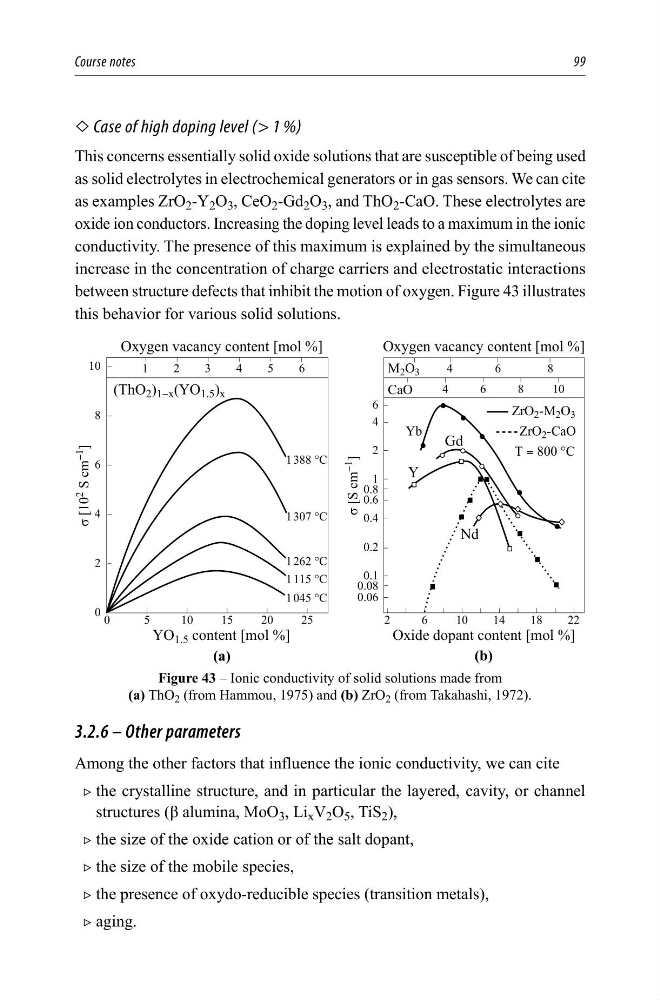
oxide ion conductors. Increasing the doping level leads to a maximum in the ionic
conductivity. The presence of this maximum is explained by the simultaneous
increase in the concentration of charge carriers and electrostatic interactions
between structure defects that inhibit the motion of oxygen. Figure 43 illustrates
this behavior for various solid solutions.
2[\JHQYDFDQF\FRQWHQW>PRO@
2[\JHQYDFDQF\FRQWHQW>PRO@
&
<2 FRQWHQW>PRO@
&
&
&
&
2[LGHGRSDQWFRQWHQW>PRO@
&D2
0 2
=U2 0 2
=U2 &D2
7&
*G
1G
7K2 <[ <2 [
D
E
ı>6FP
<
@
ı>
6FP
<
@
Figure 43 – Ionic conductivity of solid solutions made from
(a) ThO 2 (from Hammou, 1975) and (b) ZrO 2 (from Takahashi, 1972).
3.2.6 – Other parameters
Among the other factors that influence the ionic conductivity, we can cite
2 the crystalline structure, and in particular the layered, cavity, or channel
structures (β alumina, MoO 3 , Li x V 2 O 5 , TiS 2 ),
2 the size of the oxide cation or of the salt dopant,
2 the size of the mobile species,
2 the presence of oxydo-reducible species (transition metals),
2 aging.
99
L Case of high doping level (> 1 %)
This concerns essentially solid oxide solutions that are susceptible of being used
as solid electrolytes in electrochemical generators or in gas sensors. We can cite
as examples ZrO 2 -Y 2 O 3 , CeO 2 -Gd 2 O 3 , and ThO 2 -CaO. These electrolytes are
oxide ion conductors. Increasing the doping level leads to a maximum in the ionic
conductivity. The presence of this maximum is explained by the simultaneous
increase in the concentration of charge carriers and electrostatic interactions
between structure defects that inhibit the motion of oxygen. Figure 43 illustrates
this behavior for various solid solutions.
2[\JHQYDFDQF\FRQWHQW>PRO@
2[\JHQYDFDQF\FRQWHQW>PRO@
&
<2 FRQWHQW>PRO@
&
&
&
&
2[LGHGRSDQWFRQWHQW>PRO@
&D2
0 2
=U2 0 2
=U2 &D2
7&
*G
1G
7K2 <[ <2 [
D
E
ı>6FP
<
@
ı>
6FP
<
@
Figure 43 – Ionic conductivity of solid solutions made from
(a) ThO 2 (from Hammou, 1975) and (b) ZrO 2 (from Takahashi, 1972).
3.2.6 – Other parameters
Among the other factors that influence the ionic conductivity, we can cite
2 the crystalline structure, and in particular the layered, cavity, or channel
structures (β alumina, MoO 3 , Li x V 2 O 5 , TiS 2 ),
2 the size of the oxide cation or of the salt dopant,
2 the size of the mobile species,
2 the presence of oxydo-reducible species (transition metals),
2 aging.