

98
3 – Transport in ionic solids
Q
ı
ı Q
ı S
ı L
9 ;
S
ORJ>L@
ORJı
ORJ3 ;
HOHFWURO\WLF
GRPDLQ
; L
l
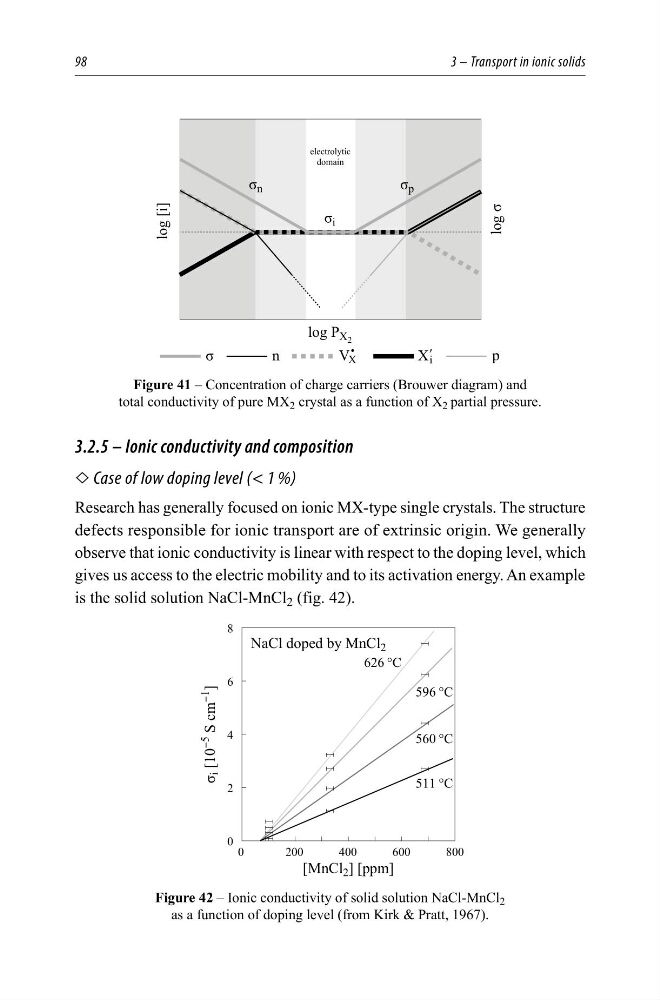
Figure 41 – Concentration of charge carriers (Brouwer diagram) and
total conductivity of pure MX 2 crystal as a function of X 2 partial pressure.
3.2.5 – Ionic conductivity and composition
L Case of low doping level (< 1 %)
Research has generally focused on ionic MX-type single crystals. The structure
defects responsible for ionic transport are of extrinsic origin. We generally
observe that ionic conductivity is linear with respect to the doping level, which
gives us access to the electric mobility and to its activation energy. An example
is the solid solution NaCl-MnCl 2 (fig. 42).
ı
L >
<
6FP
<
@
&
&
&
&
1D&OGRSHGE\0Q&O
>0Q&O @>SSP@
Figure 42 – Ionic conductivity of solid solution NaCl-MnCl 2
as a function of doping level (from Kirk & Pratt, 1967).
3 – Transport in ionic solids
Q
ı
ı Q
ı S
ı L
9 ;
S
ORJ>L@
ORJı
ORJ3 ;
HOHFWURO\WLF
GRPDLQ
; L
l
Figure 41 – Concentration of charge carriers (Brouwer diagram) and
total conductivity of pure MX 2 crystal as a function of X 2 partial pressure.
3.2.5 – Ionic conductivity and composition
L Case of low doping level (< 1 %)
Research has generally focused on ionic MX-type single crystals. The structure
defects responsible for ionic transport are of extrinsic origin. We generally
observe that ionic conductivity is linear with respect to the doping level, which
gives us access to the electric mobility and to its activation energy. An example
is the solid solution NaCl-MnCl 2 (fig. 42).
ı
L >
<
6FP
<
@
&
&
&
&
1D&OGRSHGE\0Q&O
>0Q&O @>SSP@
Figure 42 – Ionic conductivity of solid solution NaCl-MnCl 2
as a function of doping level (from Kirk & Pratt, 1967).