

Course notes
97
3.2.4 – Conductivity and environment
We limit ourselves here to the case of an MX 2 crystal, either pure or doped
by DX, where the ionic disorder is of the anionic Frenkel type. D substitutes
for M in the solid solution MX 2 -DX. The expression for particulate conductivity
due to a charged species i is given by
σ i = z i F u i C i
The environment intervenes through the concentration C i . The expressions
for this concentration as a function of partial pressure P X 2 are established by
following the approach for drawing the Brouwer diagrams. We must, however,
account for the significant difference between the ionic mobility u i and the
electronic mobility u el (u el ≈ 10
3
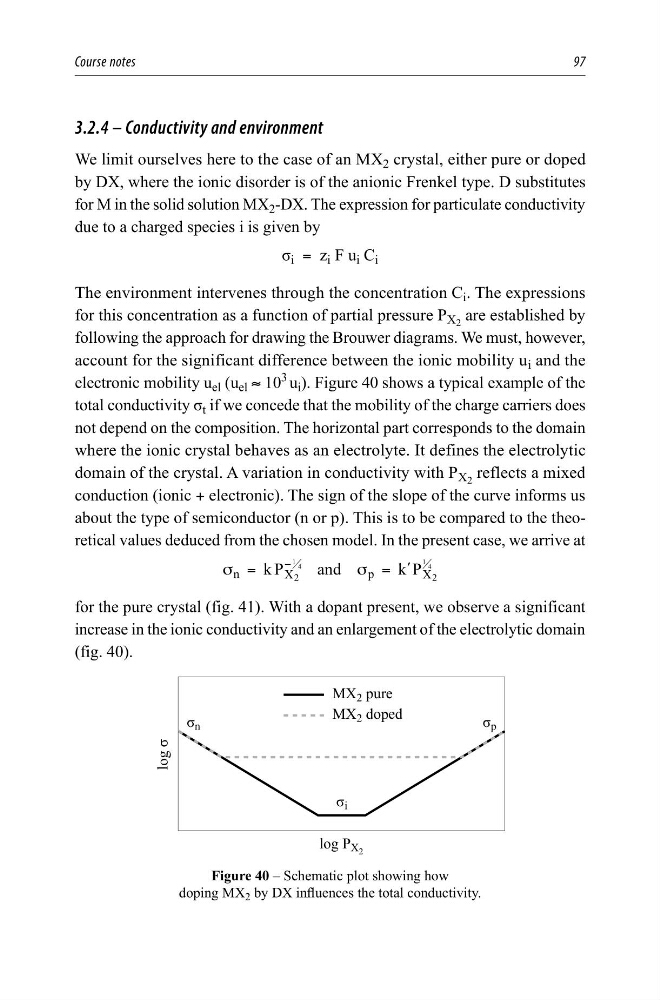
u i ). Figure 40 shows a typical example of the
total conductivity σ t if we concede that the mobility of the charge carriers does
not depend on the composition. The horizontal part corresponds to the domain
where the ionic crystal behaves as an electrolyte. It defines the electrolytic
domain of the crystal. A variation in conductivity with P X 2 reflects a mixed
conduction (ionic + electronic). The sign of the slope of the curve informs us
about the type of semiconductor (n or p). This is to be compared to the theoretical values deduced from the chosen model. In the present case, we arrive at
k P
and
kP
n
X
p
X
2
2
1 4
1 4
σ
σ
=
=
−
l
for the pure crystal (fig. 41). With a dopant present, we observe a significant
increase in the ionic conductivity and an enlargement of the electrolytic domain
(fig. 40).
ORJı
ORJ3 ;
ı L
ı S
ı Q
0; SXUH
0; GRSHG
Figure 40 – Schematic plot showing how
doping MX 2 by DX influences the total conductivity.
97
3.2.4 – Conductivity and environment
We limit ourselves here to the case of an MX 2 crystal, either pure or doped
by DX, where the ionic disorder is of the anionic Frenkel type. D substitutes
for M in the solid solution MX 2 -DX. The expression for particulate conductivity
due to a charged species i is given by
σ i = z i F u i C i
The environment intervenes through the concentration C i . The expressions
for this concentration as a function of partial pressure P X 2 are established by
following the approach for drawing the Brouwer diagrams. We must, however,
account for the significant difference between the ionic mobility u i and the
electronic mobility u el (u el ≈ 10
3
u i ). Figure 40 shows a typical example of the
total conductivity σ t if we concede that the mobility of the charge carriers does
not depend on the composition. The horizontal part corresponds to the domain
where the ionic crystal behaves as an electrolyte. It defines the electrolytic
domain of the crystal. A variation in conductivity with P X 2 reflects a mixed
conduction (ionic + electronic). The sign of the slope of the curve informs us
about the type of semiconductor (n or p). This is to be compared to the theoretical values deduced from the chosen model. In the present case, we arrive at
k P
and
kP
n
X
p
X
2
2
1 4
1 4
σ
σ
=
=
−
l
for the pure crystal (fig. 41). With a dopant present, we observe a significant
increase in the ionic conductivity and an enlargement of the electrolytic domain
(fig. 40).
ORJı
ORJ3 ;
ı L
ı S
ı Q
0; SXUH
0; GRSHG
Figure 40 – Schematic plot showing how
doping MX 2 by DX influences the total conductivity.