

Course notes
95
Note – In reality, the ion hops are correlated. This results in the introduction of
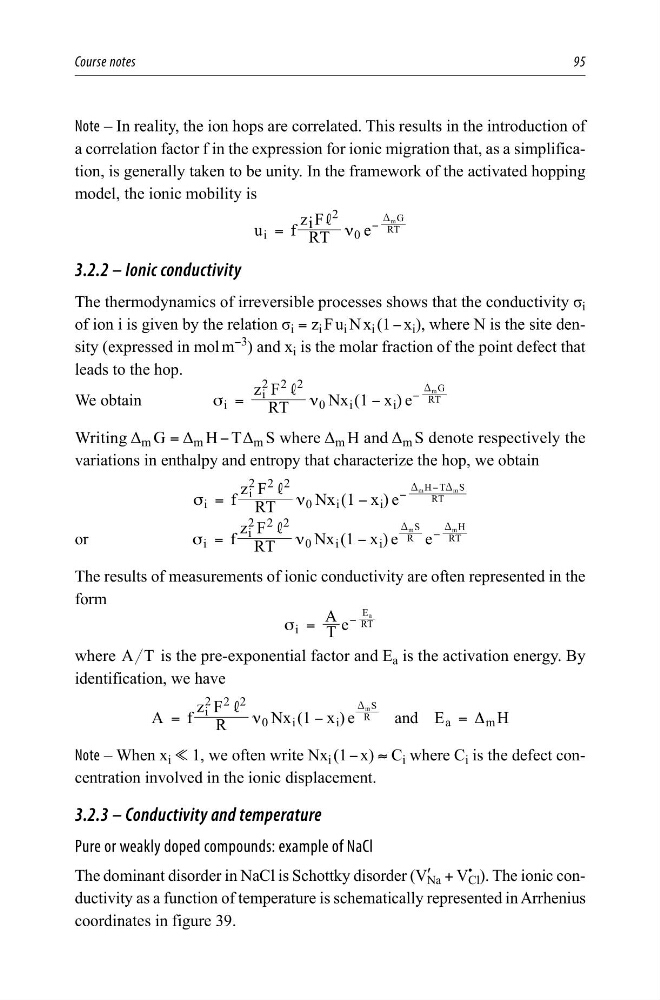
a correlation factor f in the expression for ionic migration that, as a simplification, is generally taken to be unity. In the framework of the activated hopping
model, the ionic mobility is
u
f RT
z i F
e
i
2
0
RT
G
m
, ν
=
−
D
3.2.2 – Ionic conductivity
The thermodynamics of irreversible processes shows that the conductivity σ i
of ion i is given by the relation σ i = z i F u i N x i (1 − x i ), where N is the site density (expressed in mol m
−3
) and x i is the molar fraction of the point defect that
leads to the hop.
We obtain
RT
z F
Nx (1 x ) e
i
i
2 2 2
0
i
i
RT
G
m
,
σ
ν
=
−
−
D
Writing Δ m G = Δ m H − T Δ m S where Δ m H and Δ m S denote respectively the
variations in enthalpy and entropy that characterize the hop, we obtain
f RT
z F
Nx (1 x ) e
i
i
2 2 2
0
i
i
RT
H T S
m
m
,
σ
ν
=
−
−
D
D
−
or
f RT
z F
Nx (1 x ) e
e
i
i
2 2 2
0
i
i
R
S
RT
H
m
m
,
σ
ν
=
−
−
D
D
The results of measurements of ionic conductivity are often represented in the
form
T
A
e
i
RT
E a
σ =
−
where A T is the pre-exponential factor and E a is the activation energy. By
identification, we have
A f R
z F
Nx (1 x ) e
and E
H
i
2 2 2
0
i
i
a
m
R
S
m
, ν
Δ
=
−
=
D
Note – When x i % 1, we often write Nx i (1 − x) ≈ C i where C i is the defect concentration involved in the ionic displacement.
3.2.3 – Conductivity and temperature
Pure or weakly doped compounds: example of NaCl
The dominant disorder in NaCl is Schottky disorder (V ′
Na + V
•
Cl ). The ionic conductivity as a function of temperature is schematically represented in Arrhenius
coordinates in figure 39.
95
Note – In reality, the ion hops are correlated. This results in the introduction of
a correlation factor f in the expression for ionic migration that, as a simplification, is generally taken to be unity. In the framework of the activated hopping
model, the ionic mobility is
u
f RT
z i F
e
i
2
0
RT
G
m
, ν
=
−
D
3.2.2 – Ionic conductivity
The thermodynamics of irreversible processes shows that the conductivity σ i
of ion i is given by the relation σ i = z i F u i N x i (1 − x i ), where N is the site density (expressed in mol m
−3
) and x i is the molar fraction of the point defect that
leads to the hop.
We obtain
RT
z F
Nx (1 x ) e
i
i
2 2 2
0
i
i
RT
G
m
,
σ
ν
=
−
−
D
Writing Δ m G = Δ m H − T Δ m S where Δ m H and Δ m S denote respectively the
variations in enthalpy and entropy that characterize the hop, we obtain
f RT
z F
Nx (1 x ) e
i
i
2 2 2
0
i
i
RT
H T S
m
m
,
σ
ν
=
−
−
D
D
−
or
f RT
z F
Nx (1 x ) e
e
i
i
2 2 2
0
i
i
R
S
RT
H
m
m
,
σ
ν
=
−
−
D
D
The results of measurements of ionic conductivity are often represented in the
form
T
A
e
i
RT
E a
σ =
−
where A T is the pre-exponential factor and E a is the activation energy. By
identification, we have
A f R
z F
Nx (1 x ) e
and E
H
i
2 2 2
0
i
i
a
m
R
S
m
, ν
Δ
=
−
=
D
Note – When x i % 1, we often write Nx i (1 − x) ≈ C i where C i is the defect concentration involved in the ionic displacement.
3.2.3 – Conductivity and temperature
Pure or weakly doped compounds: example of NaCl
The dominant disorder in NaCl is Schottky disorder (V ′
Na + V
•
Cl ). The ionic conductivity as a function of temperature is schematically represented in Arrhenius
coordinates in figure 39.