

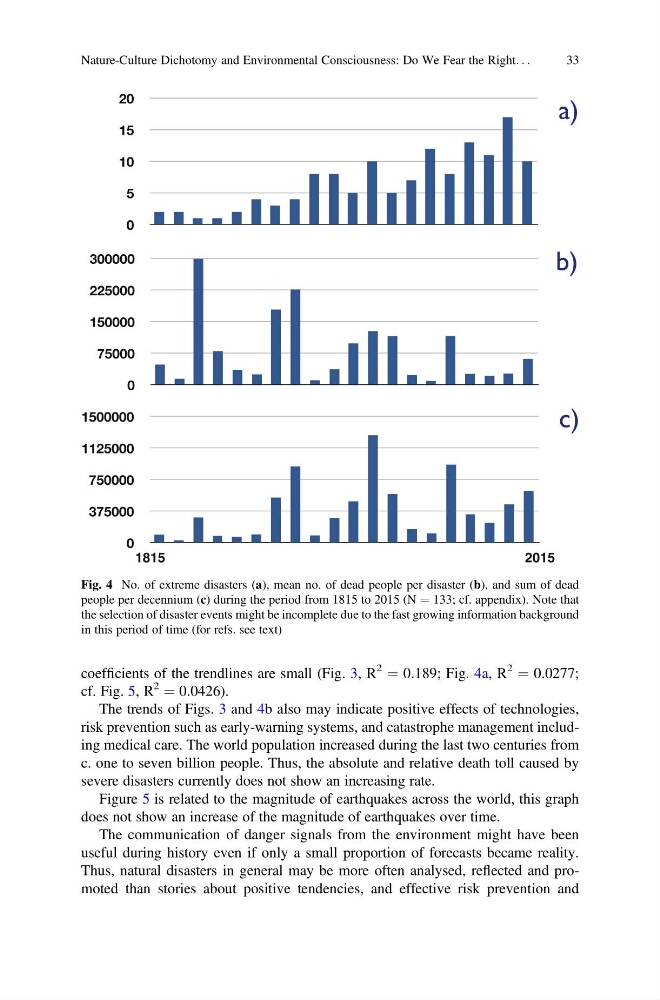
coefficients of the trendlines are small (Fig. 3, R
2
¼ 0.189; Fig. 4a, R
2
¼ 0.0277;
cf. Fig. 5, R
2
¼ 0.0426).
The trends of Figs. 3 and 4b also may indicate positive effects of technologies,
risk prevention such as early-warning systems, and catastrophe management including medical care. The world population increased during the last two centuries from
c. one to seven billion people. Thus, the absolute and relative death toll caused by
severe disasters currently does not show an increasing rate.
Figure 5 is related to the magnitude of earthquakes across the world, this graph
does not show an increase of the magnitude of earthquakes over time.
The communication of danger signals from the environment might have been
useful during history even if only a small proportion of forecasts became reality.
Thus, natural disasters in general may be more often analysed, reflected and promoted than stories about positive tendencies, and effective risk prevention and
Fig. 4 No. of extreme disasters (a), mean no. of dead people per disaster (b), and sum of dead
people per decennium (c) during the period from 1815 to 2015 (N ¼ 133; cf. appendix). Note that
the selection of disaster events might be incomplete due to the fast growing information background
in this period of time (for refs. see text)
Nature-Culture Dichotomy and Environmental Consciousness: Do We Fear the Right. . .
33
2
¼ 0.189; Fig. 4a, R
2
¼ 0.0277;
cf. Fig. 5, R
2
¼ 0.0426).
The trends of Figs. 3 and 4b also may indicate positive effects of technologies,
risk prevention such as early-warning systems, and catastrophe management including medical care. The world population increased during the last two centuries from
c. one to seven billion people. Thus, the absolute and relative death toll caused by
severe disasters currently does not show an increasing rate.
Figure 5 is related to the magnitude of earthquakes across the world, this graph
does not show an increase of the magnitude of earthquakes over time.
The communication of danger signals from the environment might have been
useful during history even if only a small proportion of forecasts became reality.
Thus, natural disasters in general may be more often analysed, reflected and promoted than stories about positive tendencies, and effective risk prevention and
Fig. 4 No. of extreme disasters (a), mean no. of dead people per disaster (b), and sum of dead
people per decennium (c) during the period from 1815 to 2015 (N ¼ 133; cf. appendix). Note that
the selection of disaster events might be incomplete due to the fast growing information background
in this period of time (for refs. see text)
Nature-Culture Dichotomy and Environmental Consciousness: Do We Fear the Right. . .
33