

Forests are depleted, deserts are growing, coral reefs are being destroyed and the
number of species extinctions is increasing.
The IPCC report with reference to global warming of 1.5
C, shows that the
frequency and magnitude of heatwaves in most land regions, heavy precipitation
events and drought in the Mediterranean, increased on a high or medium confidence
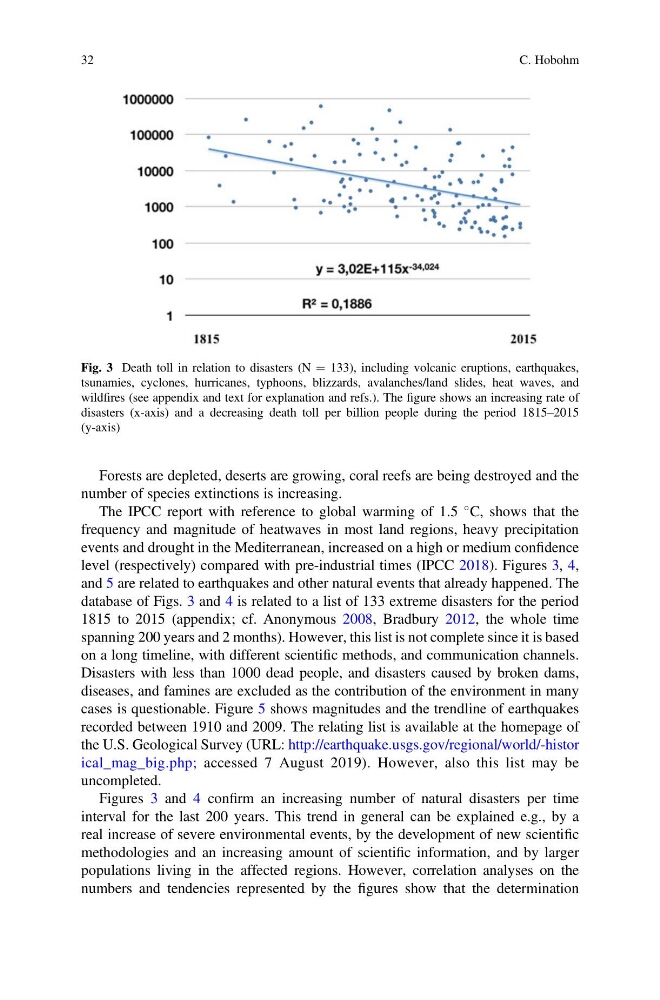
level (respectively) compared with pre-industrial times (IPCC 2018). Figures 3, 4,
and 5 are related to earthquakes and other natural events that already happened. The
database of Figs. 3 and 4 is related to a list of 133 extreme disasters for the period
1815 to 2015 (appendix; cf. Anonymous 2008, Bradbury 2012, the whole time
spanning 200 years and 2 months). However, this list is not complete since it is based
on a long timeline, with different scientific methods, and communication channels.
Disasters with less than 1000 dead people, and disasters caused by broken dams,
diseases, and famines are excluded as the contribution of the environment in many
cases is questionable. Figure 5 shows magnitudes and the trendline of earthquakes
recorded between 1910 and 2009. The relating list is available at the homepage of
the U.S. Geological Survey (URL: http://earthquake.usgs.gov/regional/world/-histor
ical_mag_big.php; accessed 7 August 2019). However, also this list may be
uncompleted.
Figures 3 and 4 confirm an increasing number of natural disasters per time
interval for the last 200 years. This trend in general can be explained e.g., by a
real increase of severe environmental events, by the development of new scientific
methodologies and an increasing amount of scientific information, and by larger
populations living in the affected regions. However, correlation analyses on the
numbers and tendencies represented by the figures show that the determination
Fig. 3 Death toll in relation to disasters (N ¼ 133), including volcanic eruptions, earthquakes,
tsunamies, cyclones, hurricanes, typhoons, blizzards, avalanches/land slides, heat waves, and
wildfires (see appendix and text for explanation and refs.). The figure shows an increasing rate of
disasters (x-axis) and a decreasing death toll per billion people during the period 1815–2015
(y-axis)
32
C. Hobohm
number of species extinctions is increasing.
The IPCC report with reference to global warming of 1.5
C, shows that the
frequency and magnitude of heatwaves in most land regions, heavy precipitation
events and drought in the Mediterranean, increased on a high or medium confidence
level (respectively) compared with pre-industrial times (IPCC 2018). Figures 3, 4,
and 5 are related to earthquakes and other natural events that already happened. The
database of Figs. 3 and 4 is related to a list of 133 extreme disasters for the period
1815 to 2015 (appendix; cf. Anonymous 2008, Bradbury 2012, the whole time
spanning 200 years and 2 months). However, this list is not complete since it is based
on a long timeline, with different scientific methods, and communication channels.
Disasters with less than 1000 dead people, and disasters caused by broken dams,
diseases, and famines are excluded as the contribution of the environment in many
cases is questionable. Figure 5 shows magnitudes and the trendline of earthquakes
recorded between 1910 and 2009. The relating list is available at the homepage of
the U.S. Geological Survey (URL: http://earthquake.usgs.gov/regional/world/-histor
ical_mag_big.php; accessed 7 August 2019). However, also this list may be
uncompleted.
Figures 3 and 4 confirm an increasing number of natural disasters per time
interval for the last 200 years. This trend in general can be explained e.g., by a
real increase of severe environmental events, by the development of new scientific
methodologies and an increasing amount of scientific information, and by larger
populations living in the affected regions. However, correlation analyses on the
numbers and tendencies represented by the figures show that the determination
Fig. 3 Death toll in relation to disasters (N ¼ 133), including volcanic eruptions, earthquakes,
tsunamies, cyclones, hurricanes, typhoons, blizzards, avalanches/land slides, heat waves, and
wildfires (see appendix and text for explanation and refs.). The figure shows an increasing rate of
disasters (x-axis) and a decreasing death toll per billion people during the period 1815–2015
(y-axis)
32
C. Hobohm