

5 Suppression of Internal Conversions from Pseudo-Degenerate …
85
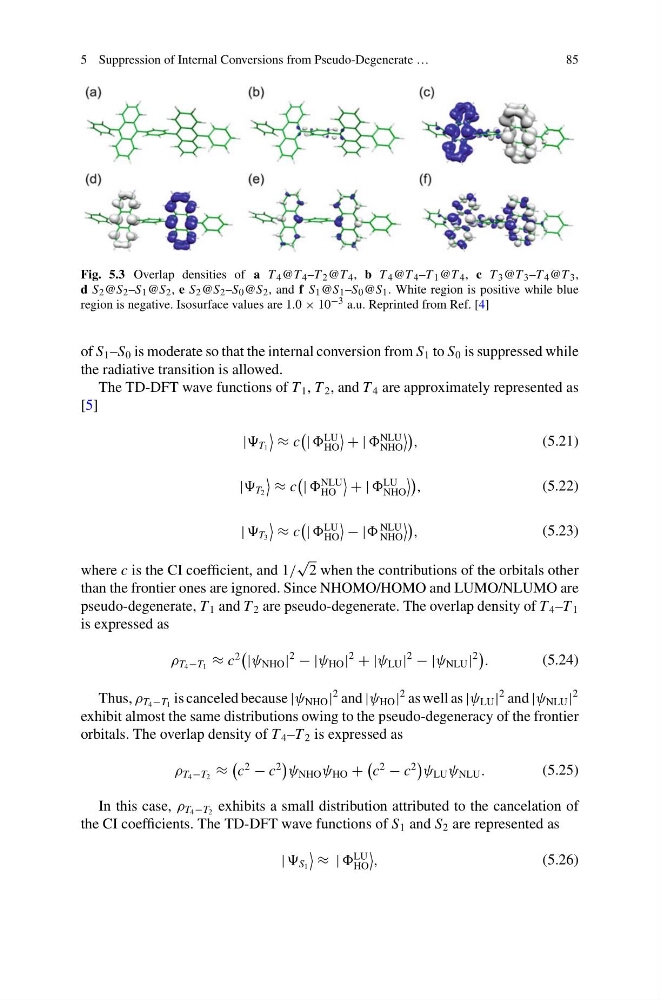
Fig. 5.3 Overlap densities of a T 4 @T 4 –T 2 @T 4 , b T 4 @T 4 –T 1 @T 4 , c T 3 @T 3 –T 4 @T 3 ,
d S 2 @S 2 –S 1 @S 2 , e S 2 @S 2 –S 0 @S 2 , and f S 1 @S 1 –S 0 @S 1 . White region is positive while blue
region is negative. Isosurface values are 1.0 × 10 −3 a.u. Reprinted from Ref. [4]
of S 1 –S 0 is moderate so that the internal conversion from S 1 to S 0 is suppressed while
the radiative transition is allowed.
The TD-DFT wave functions of T 1 , T 2 , and T 4 are approximately represented as
[5]
| T 1
≈ c
|
LU
HO
+ |
NLU
NHO
,
(5.21)
| T 2
≈ c
|
NLU
HO
+ |
LU
NHO
,
(5.22)
| T 3
≈ c
|
LU
HO
− |
NLU
NHO
,
(5.23)
where c is the CI coefficient, and 1/
√
2 when the contributions of the orbitals other
than the frontier ones are ignored. Since NHOMO/HOMO and LUMO/NLUMO are
pseudo-degenerate, T 1 and T 2 are pseudo-degenerate. The overlap density of T 4 –T 1
is expressed as
ρ T 4 −T 1 ≈ c
2
|ψ NHO |
2
− |ψ HO |
2
+ |ψ LU |
2
− |ψ NLU |
2
.
(5.24)
Thus, ρ T 4 −T 1 is canceled because |ψ NHO |
2 and |ψ HO |
2 as well as |ψ LU |
2 and |ψ NLU |
2
exhibit almost the same distributions owing to the pseudo-degeneracy of the frontier
orbitals. The overlap density of T 4 –T 2 is expressed as
ρ T 4 −T 2 ≈
c
2
− c
2
ψ NHO ψ HO +
c
2
− c
2
ψ LU ψ NLU .
(5.25)
In this case, ρ T 4 −T 2 exhibits a small distribution attributed to the cancelation of
the CI coefficients. The TD-DFT wave functions of S 1 and S 2 are represented as
| S 1
≈ |
LU
HO
,
(5.26)
85
Fig. 5.3 Overlap densities of a T 4 @T 4 –T 2 @T 4 , b T 4 @T 4 –T 1 @T 4 , c T 3 @T 3 –T 4 @T 3 ,
d S 2 @S 2 –S 1 @S 2 , e S 2 @S 2 –S 0 @S 2 , and f S 1 @S 1 –S 0 @S 1 . White region is positive while blue
region is negative. Isosurface values are 1.0 × 10 −3 a.u. Reprinted from Ref. [4]
of S 1 –S 0 is moderate so that the internal conversion from S 1 to S 0 is suppressed while
the radiative transition is allowed.
The TD-DFT wave functions of T 1 , T 2 , and T 4 are approximately represented as
[5]
| T 1
≈ c
|
LU
HO
+ |
NLU
NHO
,
(5.21)
| T 2
≈ c
|
NLU
HO
+ |
LU
NHO
,
(5.22)
| T 3
≈ c
|
LU
HO
− |
NLU
NHO
,
(5.23)
where c is the CI coefficient, and 1/
√
2 when the contributions of the orbitals other
than the frontier ones are ignored. Since NHOMO/HOMO and LUMO/NLUMO are
pseudo-degenerate, T 1 and T 2 are pseudo-degenerate. The overlap density of T 4 –T 1
is expressed as
ρ T 4 −T 1 ≈ c
2
|ψ NHO |
2
− |ψ HO |
2
+ |ψ LU |
2
− |ψ NLU |
2
.
(5.24)
Thus, ρ T 4 −T 1 is canceled because |ψ NHO |
2 and |ψ HO |
2 as well as |ψ LU |
2 and |ψ NLU |
2
exhibit almost the same distributions owing to the pseudo-degeneracy of the frontier
orbitals. The overlap density of T 4 –T 2 is expressed as
ρ T 4 −T 2 ≈
c
2
− c
2
ψ NHO ψ HO +
c
2
− c
2
ψ LU ψ NLU .
(5.25)
In this case, ρ T 4 −T 2 exhibits a small distribution attributed to the cancelation of
the CI coefficients. The TD-DFT wave functions of S 1 and S 2 are represented as
| S 1
≈ |
LU
HO
,
(5.26)