

574
M. Morimoto and M. Irie
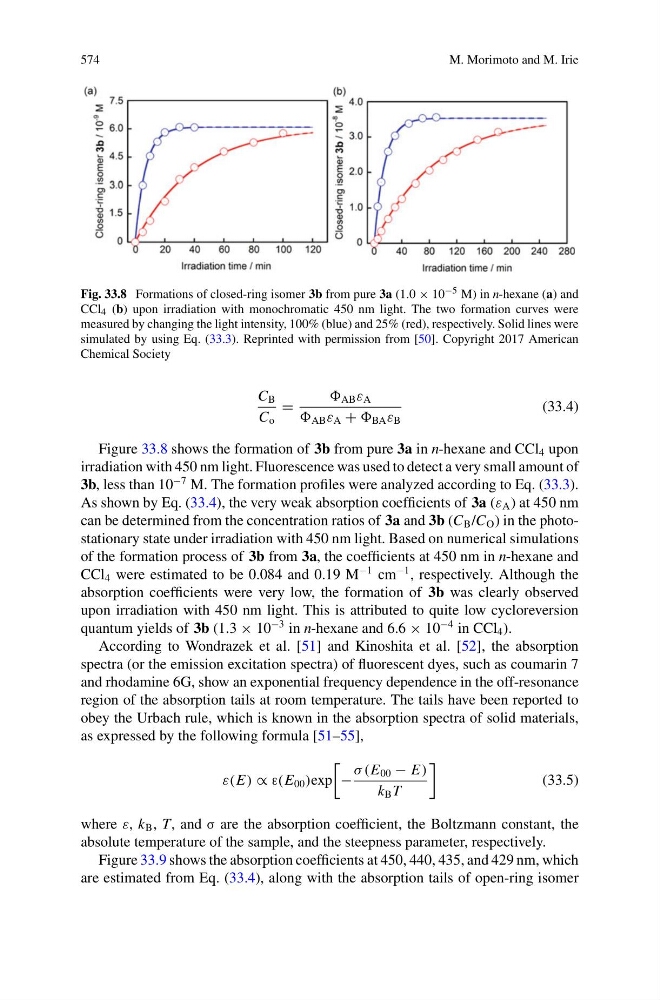
Fig. 33.8 Formations of closed-ring isomer 3b from pure 3a (1.0 × 10 −5 M) in n-hexane (a) and
CCl 4 (b) upon irradiation with monochromatic 450 nm light. The two formation curves were
measured by changing the light intensity, 100% (blue) and 25% (red), respectively. Solid lines were
simulated by using Eq. (33.3). Reprinted with permission from [50]. Copyright 2017 American
Chemical Society
C B
C o
=
AB ε A
AB ε A + BA ε B
(33.4)
Figure 33.8 shows the formation of 3b from pure 3a in n-hexane and CCl 4 upon
irradiation with 450 nm light. Fluorescence was used to detect a very small amount of
3b, less than 10
−7 M. The formation profiles were analyzed according to Eq. (33.3).
As shown by Eq. (33.4), the very weak absorption coefficients of 3a (ε A ) at 450 nm
can be determined from the concentration ratios of 3a and 3b (C B /C O ) in the photostationary state under irradiation with 450 nm light. Based on numerical simulations
of the formation process of 3b from 3a, the coefficients at 450 nm in n-hexane and
CCl 4 were estimated to be 0.084 and 0.19 M
−1 cm
−1 , respectively. Although the
absorption coefficients were very low, the formation of 3b was clearly observed
upon irradiation with 450 nm light. This is attributed to quite low cycloreversion
quantum yields of 3b (1.3 × 10
−3 in n-hexane and 6.6 × 10
−4 in CCl 4 ).
According to Wondrazek et al. [51] and Kinoshita et al. [52], the absorption
spectra (or the emission excitation spectra) of fluorescent dyes, such as coumarin 7
and rhodamine 6G, show an exponential frequency dependence in the off-resonance
region of the absorption tails at room temperature. The tails have been reported to
obey the Urbach rule, which is known in the absorption spectra of solid materials,
as expressed by the following formula [51–55],
ε(E) ∝ ε(E 00 )exp
−
σ (E 00 − E)
k B T
(33.5)
where ε, k B , T, and σ are the absorption coefficient, the Boltzmann constant, the
absolute temperature of the sample, and the steepness parameter, respectively.
Figure 33.9 shows the absorption coefficients at 450, 440, 435, and 429 nm, which
are estimated from Eq. (33.4), along with the absorption tails of open-ring isomer
M. Morimoto and M. Irie
Fig. 33.8 Formations of closed-ring isomer 3b from pure 3a (1.0 × 10 −5 M) in n-hexane (a) and
CCl 4 (b) upon irradiation with monochromatic 450 nm light. The two formation curves were
measured by changing the light intensity, 100% (blue) and 25% (red), respectively. Solid lines were
simulated by using Eq. (33.3). Reprinted with permission from [50]. Copyright 2017 American
Chemical Society
C B
C o
=
AB ε A
AB ε A + BA ε B
(33.4)
Figure 33.8 shows the formation of 3b from pure 3a in n-hexane and CCl 4 upon
irradiation with 450 nm light. Fluorescence was used to detect a very small amount of
3b, less than 10
−7 M. The formation profiles were analyzed according to Eq. (33.3).
As shown by Eq. (33.4), the very weak absorption coefficients of 3a (ε A ) at 450 nm
can be determined from the concentration ratios of 3a and 3b (C B /C O ) in the photostationary state under irradiation with 450 nm light. Based on numerical simulations
of the formation process of 3b from 3a, the coefficients at 450 nm in n-hexane and
CCl 4 were estimated to be 0.084 and 0.19 M
−1 cm
−1 , respectively. Although the
absorption coefficients were very low, the formation of 3b was clearly observed
upon irradiation with 450 nm light. This is attributed to quite low cycloreversion
quantum yields of 3b (1.3 × 10
−3 in n-hexane and 6.6 × 10
−4 in CCl 4 ).
According to Wondrazek et al. [51] and Kinoshita et al. [52], the absorption
spectra (or the emission excitation spectra) of fluorescent dyes, such as coumarin 7
and rhodamine 6G, show an exponential frequency dependence in the off-resonance
region of the absorption tails at room temperature. The tails have been reported to
obey the Urbach rule, which is known in the absorption spectra of solid materials,
as expressed by the following formula [51–55],
ε(E) ∝ ε(E 00 )exp
−
σ (E 00 − E)
k B T
(33.5)
where ε, k B , T, and σ are the absorption coefficient, the Boltzmann constant, the
absolute temperature of the sample, and the steepness parameter, respectively.
Figure 33.9 shows the absorption coefficients at 450, 440, 435, and 429 nm, which
are estimated from Eq. (33.4), along with the absorption tails of open-ring isomer