

544
F. Ito
peak at 3420 cm
−1 . A broad absorption band was observed for Am in the range
of 3500–3300 cm
−1 along with a peak located at 3380 cm
−1 . The IR bands in the
region from 3530 to 3480 cm
−1 can be assigned to the NH stretching mode of
pyrrolyl groups. The IR spectral changes of the peaks related to NH bonds reflect
the different intermolecular interactions in the polymorphs and amorphous phase
of 1, which depend on the molecular stacking structure. A molecule of 1 forms
four hydrogen bonds (N–H···F) in its crystal structure. Although this number of
hydrogen bonds is identical in each polymorph, the IR spectral peaks exhibit distinct
differences in the region of the NH stretching mode. These findings indicate that the
NH stretching vibration mode is affected by intermolecular hydrogen bonding. The
broadband observed for Am suggests that intermolecular interactions are present at
many sites of the molecules in the amorphous phase.
It has been reported that 1y transforms to 1r at around 160 °C [32]. Differential
scanning calorimetry (DSC) measurements were carried out to investigate the thermal
properties of 1y. The DSC thermograms of 1y showed two strong peaks at 246 °C
(H m1 = − 13.8 J/g) and 253 °C (H m2 = − 103.3 J/g), indicating that the crystals
melt in this temperature range. In addition, the DSC thermogram showed a weak
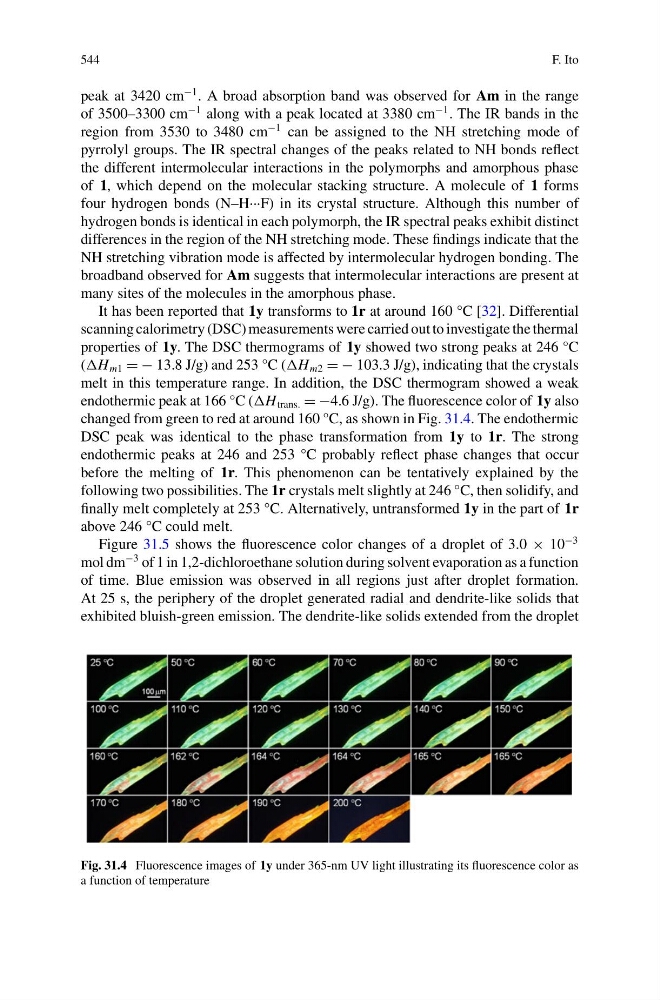
endothermic peak at 166 °C (H trans. = −4.6 J/g). The fluorescence color of 1y also
changed from green to red at around 160 °C, as shown in Fig. 31.4. The endothermic
DSC peak was identical to the phase transformation from 1y to 1r. The strong
endothermic peaks at 246 and 253 °C probably reflect phase changes that occur
before the melting of 1r. This phenomenon can be tentatively explained by the
following two possibilities. The 1r crystals melt slightly at 246 °C, then solidify, and
finally melt completely at 253 °C. Alternatively, untransformed 1y in the part of 1r
above 246 °C could melt.
Figure 31.5 shows the fluorescence color changes of a droplet of 3.0 × 10
−3
mol dm
−3 of 1 in 1,2-dichloroethane solution during solvent evaporation as a function
of time. Blue emission was observed in all regions just after droplet formation.
At 25 s, the periphery of the droplet generated radial and dendrite-like solids that
exhibited bluish-green emission. The dendrite-like solids extended from the droplet
Fig. 31.4 Fluorescence images of 1y under 365-nm UV light illustrating its fluorescence color as
a function of temperature
F. Ito
peak at 3420 cm
−1 . A broad absorption band was observed for Am in the range
of 3500–3300 cm
−1 along with a peak located at 3380 cm
−1 . The IR bands in the
region from 3530 to 3480 cm
−1 can be assigned to the NH stretching mode of
pyrrolyl groups. The IR spectral changes of the peaks related to NH bonds reflect
the different intermolecular interactions in the polymorphs and amorphous phase
of 1, which depend on the molecular stacking structure. A molecule of 1 forms
four hydrogen bonds (N–H···F) in its crystal structure. Although this number of
hydrogen bonds is identical in each polymorph, the IR spectral peaks exhibit distinct
differences in the region of the NH stretching mode. These findings indicate that the
NH stretching vibration mode is affected by intermolecular hydrogen bonding. The
broadband observed for Am suggests that intermolecular interactions are present at
many sites of the molecules in the amorphous phase.
It has been reported that 1y transforms to 1r at around 160 °C [32]. Differential
scanning calorimetry (DSC) measurements were carried out to investigate the thermal
properties of 1y. The DSC thermograms of 1y showed two strong peaks at 246 °C
(H m1 = − 13.8 J/g) and 253 °C (H m2 = − 103.3 J/g), indicating that the crystals
melt in this temperature range. In addition, the DSC thermogram showed a weak
endothermic peak at 166 °C (H trans. = −4.6 J/g). The fluorescence color of 1y also
changed from green to red at around 160 °C, as shown in Fig. 31.4. The endothermic
DSC peak was identical to the phase transformation from 1y to 1r. The strong
endothermic peaks at 246 and 253 °C probably reflect phase changes that occur
before the melting of 1r. This phenomenon can be tentatively explained by the
following two possibilities. The 1r crystals melt slightly at 246 °C, then solidify, and
finally melt completely at 253 °C. Alternatively, untransformed 1y in the part of 1r
above 246 °C could melt.
Figure 31.5 shows the fluorescence color changes of a droplet of 3.0 × 10
−3
mol dm
−3 of 1 in 1,2-dichloroethane solution during solvent evaporation as a function
of time. Blue emission was observed in all regions just after droplet formation.
At 25 s, the periphery of the droplet generated radial and dendrite-like solids that
exhibited bluish-green emission. The dendrite-like solids extended from the droplet
Fig. 31.4 Fluorescence images of 1y under 365-nm UV light illustrating its fluorescence color as
a function of temperature