

31 Cooperative and Hierarchal Photoresponses of Molecular …
543
1.2
1.0
0.8
0.6
0.4
0.2
0.0
Intensity / a.u.
800
700
600
500
400
Wavelength / nm
1y
1r
Am.
1v
(b)
(c)
(a)
(d)
4
10
2
2
4
10
3
2
4
10
4
Intensity
120
100
80
60
40
20
Time / ns
1y
1v
1r
Am
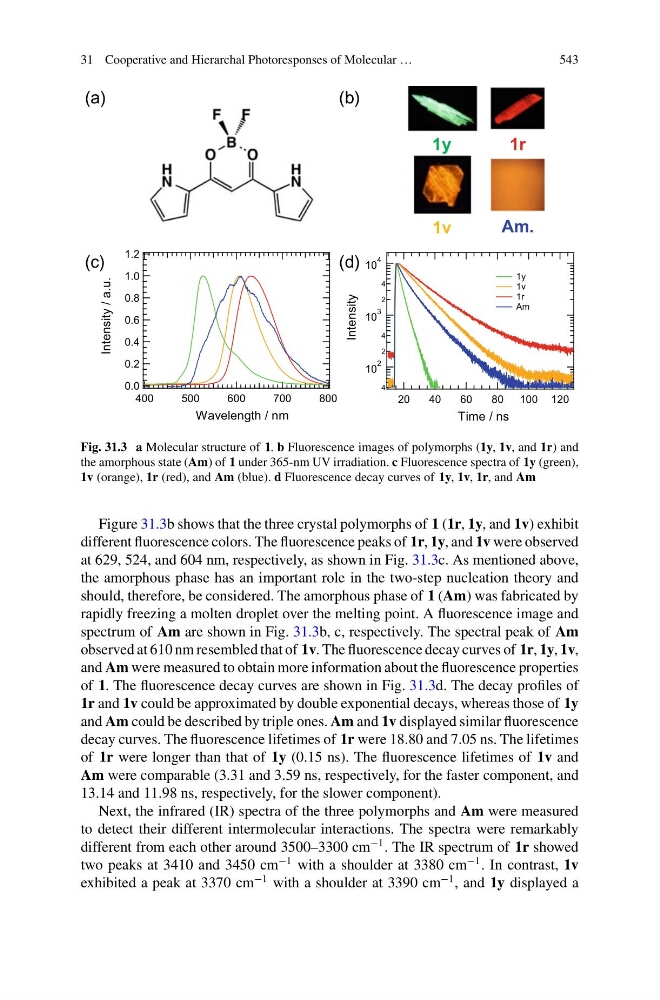
Fig. 31.3 a Molecular structure of 1. b Fluorescence images of polymorphs (1y, 1v, and 1r) and
the amorphous state (Am) of 1 under 365-nm UV irradiation. c Fluorescence spectra of 1y (green),
1v (orange), 1r (red), and Am (blue). d Fluorescence decay curves of 1y, 1v, 1r, and Am
Figure 31.3b shows that the three crystal polymorphs of 1 (1r, 1y, and 1v) exhibit
different fluorescence colors. The fluorescence peaks of 1r, 1y, and 1v were observed
at 629, 524, and 604 nm, respectively, as shown in Fig. 31.3c. As mentioned above,
the amorphous phase has an important role in the two-step nucleation theory and
should, therefore, be considered. The amorphous phase of 1 (Am) was fabricated by
rapidly freezing a molten droplet over the melting point. A fluorescence image and
spectrum of Am are shown in Fig. 31.3b, c, respectively. The spectral peak of Am
observed at 610 nm resembled that of 1v. The fluorescence decay curves of 1r, 1y, 1v,
and Am were measured to obtain more information about the fluorescence properties
of 1. The fluorescence decay curves are shown in Fig. 31.3d. The decay profiles of
1r and 1v could be approximated by double exponential decays, whereas those of 1y
and Am could be described by triple ones. Am and 1v displayed similar fluorescence
decay curves. The fluorescence lifetimes of 1r were 18.80 and 7.05 ns. The lifetimes
of 1r were longer than that of 1y (0.15 ns). The fluorescence lifetimes of 1v and
Am were comparable (3.31 and 3.59 ns, respectively, for the faster component, and
13.14 and 11.98 ns, respectively, for the slower component).
Next, the infrared (IR) spectra of the three polymorphs and Am were measured
to detect their different intermolecular interactions. The spectra were remarkably
different from each other around 3500–3300 cm
−1 . The IR spectrum of 1r showed
two peaks at 3410 and 3450 cm
−1 with a shoulder at 3380 cm
−1 . In contrast, 1v
exhibited a peak at 3370 cm
−1 with a shoulder at 3390 cm
−1 , and 1y displayed a
543
1.2
1.0
0.8
0.6
0.4
0.2
0.0
Intensity / a.u.
800
700
600
500
400
Wavelength / nm
1y
1r
Am.
1v
(b)
(c)
(a)
(d)
4
10
2
2
4
10
3
2
4
10
4
Intensity
120
100
80
60
40
20
Time / ns
1y
1v
1r
Am
Fig. 31.3 a Molecular structure of 1. b Fluorescence images of polymorphs (1y, 1v, and 1r) and
the amorphous state (Am) of 1 under 365-nm UV irradiation. c Fluorescence spectra of 1y (green),
1v (orange), 1r (red), and Am (blue). d Fluorescence decay curves of 1y, 1v, 1r, and Am
Figure 31.3b shows that the three crystal polymorphs of 1 (1r, 1y, and 1v) exhibit
different fluorescence colors. The fluorescence peaks of 1r, 1y, and 1v were observed
at 629, 524, and 604 nm, respectively, as shown in Fig. 31.3c. As mentioned above,
the amorphous phase has an important role in the two-step nucleation theory and
should, therefore, be considered. The amorphous phase of 1 (Am) was fabricated by
rapidly freezing a molten droplet over the melting point. A fluorescence image and
spectrum of Am are shown in Fig. 31.3b, c, respectively. The spectral peak of Am
observed at 610 nm resembled that of 1v. The fluorescence decay curves of 1r, 1y, 1v,
and Am were measured to obtain more information about the fluorescence properties
of 1. The fluorescence decay curves are shown in Fig. 31.3d. The decay profiles of
1r and 1v could be approximated by double exponential decays, whereas those of 1y
and Am could be described by triple ones. Am and 1v displayed similar fluorescence
decay curves. The fluorescence lifetimes of 1r were 18.80 and 7.05 ns. The lifetimes
of 1r were longer than that of 1y (0.15 ns). The fluorescence lifetimes of 1v and
Am were comparable (3.31 and 3.59 ns, respectively, for the faster component, and
13.14 and 11.98 ns, respectively, for the slower component).
Next, the infrared (IR) spectra of the three polymorphs and Am were measured
to detect their different intermolecular interactions. The spectra were remarkably
different from each other around 3500–3300 cm
−1 . The IR spectrum of 1r showed
two peaks at 3410 and 3450 cm
−1 with a shoulder at 3380 cm
−1 . In contrast, 1v
exhibited a peak at 3370 cm
−1 with a shoulder at 3390 cm
−1 , and 1y displayed a