

31 Cooperative and Hierarchal Photoresponses of Molecular …
545
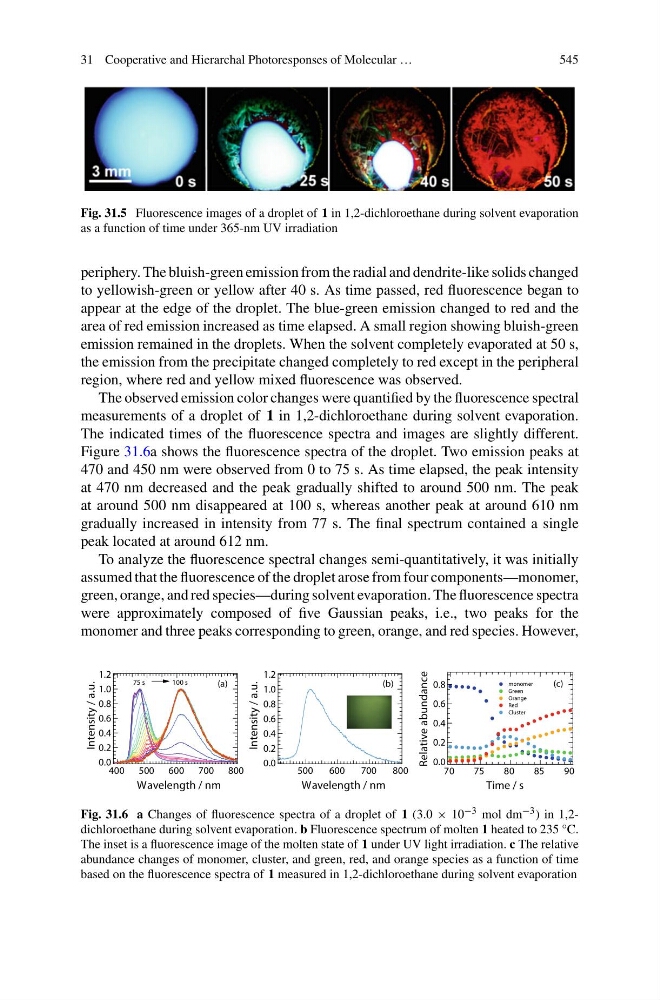
Fig. 31.5 Fluorescence images of a droplet of 1 in 1,2-dichloroethane during solvent evaporation
as a function of time under 365-nm UV irradiation
periphery. The bluish-green emission from the radial and dendrite-like solids changed
to yellowish-green or yellow after 40 s. As time passed, red fluorescence began to
appear at the edge of the droplet. The blue-green emission changed to red and the
area of red emission increased as time elapsed. A small region showing bluish-green
emission remained in the droplets. When the solvent completely evaporated at 50 s,
the emission from the precipitate changed completely to red except in the peripheral
region, where red and yellow mixed fluorescence was observed.
The observed emission color changes were quantified by the fluorescence spectral
measurements of a droplet of 1 in 1,2-dichloroethane during solvent evaporation.
The indicated times of the fluorescence spectra and images are slightly different.
Figure 31.6a shows the fluorescence spectra of the droplet. Two emission peaks at
470 and 450 nm were observed from 0 to 75 s. As time elapsed, the peak intensity
at 470 nm decreased and the peak gradually shifted to around 500 nm. The peak
at around 500 nm disappeared at 100 s, whereas another peak at around 610 nm
gradually increased in intensity from 77 s. The final spectrum contained a single
peak located at around 612 nm.
To analyze the fluorescence spectral changes semi-quantitatively, it was initially
assumed that the fluorescence of the droplet arose from four components—monomer,
green, orange, and red species—during solvent evaporation. The fluorescence spectra
were approximately composed of five Gaussian peaks, i.e., two peaks for the
monomer and three peaks corresponding to green, orange, and red species. However,
1.2
1.0
0.8
0.6
0.4
0.2
0.0
Intensity / a.u.
800
700
600
500
Wavelength / nm
1.2
1.0
0.8
0.6
0.4
0.2
0.0
Intensity / a.u.
800
700
600
500
400
Wavelength / nm
75 s
100 s
(a)
(b)
(c)
0.8
0.6
0.4
0.2
0.0
Relative abundance
90
85
80
75
70
Time / s
monomer
Green
Orange
Red
Cluster
Fig. 31.6 a Changes of fluorescence spectra of a droplet of 1 (3.0 × 10 −3 mol dm −3 ) in 1,2dichloroethane during solvent evaporation. b Fluorescence spectrum of molten 1 heated to 235 °C.
The inset is a fluorescence image of the molten state of 1 under UV light irradiation. c The relative
abundance changes of monomer, cluster, and green, red, and orange species as a function of time
based on the fluorescence spectra of 1 measured in 1,2-dichloroethane during solvent evaporation
545
Fig. 31.5 Fluorescence images of a droplet of 1 in 1,2-dichloroethane during solvent evaporation
as a function of time under 365-nm UV irradiation
periphery. The bluish-green emission from the radial and dendrite-like solids changed
to yellowish-green or yellow after 40 s. As time passed, red fluorescence began to
appear at the edge of the droplet. The blue-green emission changed to red and the
area of red emission increased as time elapsed. A small region showing bluish-green
emission remained in the droplets. When the solvent completely evaporated at 50 s,
the emission from the precipitate changed completely to red except in the peripheral
region, where red and yellow mixed fluorescence was observed.
The observed emission color changes were quantified by the fluorescence spectral
measurements of a droplet of 1 in 1,2-dichloroethane during solvent evaporation.
The indicated times of the fluorescence spectra and images are slightly different.
Figure 31.6a shows the fluorescence spectra of the droplet. Two emission peaks at
470 and 450 nm were observed from 0 to 75 s. As time elapsed, the peak intensity
at 470 nm decreased and the peak gradually shifted to around 500 nm. The peak
at around 500 nm disappeared at 100 s, whereas another peak at around 610 nm
gradually increased in intensity from 77 s. The final spectrum contained a single
peak located at around 612 nm.
To analyze the fluorescence spectral changes semi-quantitatively, it was initially
assumed that the fluorescence of the droplet arose from four components—monomer,
green, orange, and red species—during solvent evaporation. The fluorescence spectra
were approximately composed of five Gaussian peaks, i.e., two peaks for the
monomer and three peaks corresponding to green, orange, and red species. However,
1.2
1.0
0.8
0.6
0.4
0.2
0.0
Intensity / a.u.
800
700
600
500
Wavelength / nm
1.2
1.0
0.8
0.6
0.4
0.2
0.0
Intensity / a.u.
800
700
600
500
400
Wavelength / nm
75 s
100 s
(a)
(b)
(c)
0.8
0.6
0.4
0.2
0.0
Relative abundance
90
85
80
75
70
Time / s
monomer
Green
Orange
Red
Cluster
Fig. 31.6 a Changes of fluorescence spectra of a droplet of 1 (3.0 × 10 −3 mol dm −3 ) in 1,2dichloroethane during solvent evaporation. b Fluorescence spectrum of molten 1 heated to 235 °C.
The inset is a fluorescence image of the molten state of 1 under UV light irradiation. c The relative
abundance changes of monomer, cluster, and green, red, and orange species as a function of time
based on the fluorescence spectra of 1 measured in 1,2-dichloroethane during solvent evaporation