

502
Y. Ishibashi and T. Asahi
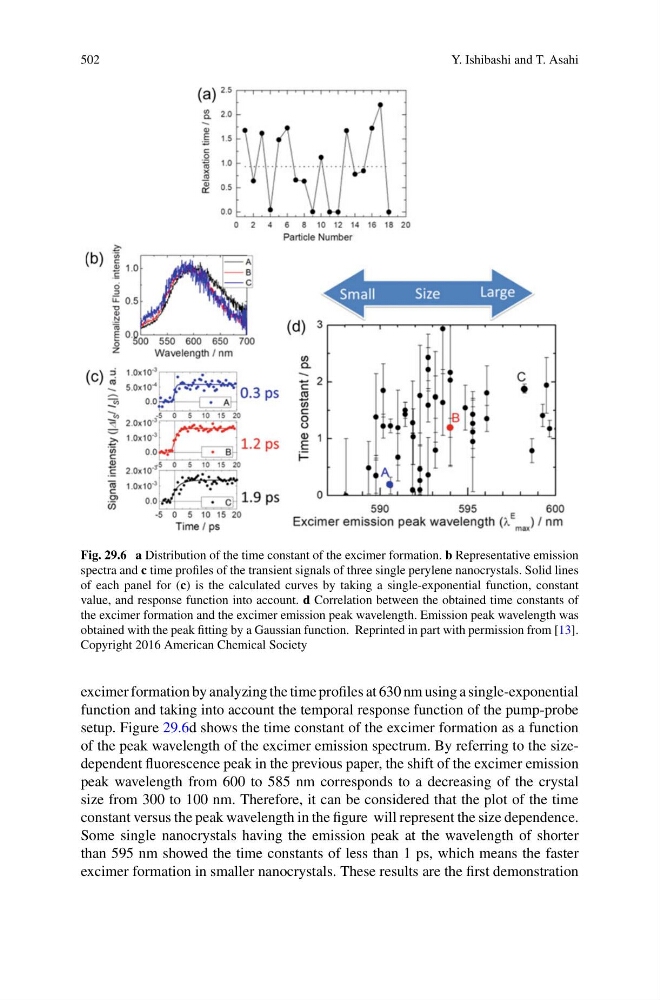
Fig. 29.6 a Distribution of the time constant of the excimer formation. b Representative emission
spectra and c time profiles of the transient signals of three single perylene nanocrystals. Solid lines
of each panel for (c) is the calculated curves by taking a single-exponential function, constant
value, and response function into account. d Correlation between the obtained time constants of
the excimer formation and the excimer emission peak wavelength. Emission peak wavelength was
obtained with the peak fitting by a Gaussian function. Reprinted in part with permission from [13].
Copyright 2016 American Chemical Society
excimer formation by analyzing the time profiles at 630 nm using a single-exponential
function and taking into account the temporal response function of the pump-probe
setup. Figure 29.6d shows the time constant of the excimer formation as a function
of the peak wavelength of the excimer emission spectrum. By referring to the sizedependent fluorescence peak in the previous paper, the shift of the excimer emission
peak wavelength from 600 to 585 nm corresponds to a decreasing of the crystal
size from 300 to 100 nm. Therefore, it can be considered that the plot of the time
constant versus the peak wavelength in the figure will represent the size dependence.
Some single nanocrystals having the emission peak at the wavelength of shorter
than 595 nm showed the time constants of less than 1 ps, which means the faster
excimer formation in smaller nanocrystals. These results are the first demonstration
Y. Ishibashi and T. Asahi
Fig. 29.6 a Distribution of the time constant of the excimer formation. b Representative emission
spectra and c time profiles of the transient signals of three single perylene nanocrystals. Solid lines
of each panel for (c) is the calculated curves by taking a single-exponential function, constant
value, and response function into account. d Correlation between the obtained time constants of
the excimer formation and the excimer emission peak wavelength. Emission peak wavelength was
obtained with the peak fitting by a Gaussian function. Reprinted in part with permission from [13].
Copyright 2016 American Chemical Society
excimer formation by analyzing the time profiles at 630 nm using a single-exponential
function and taking into account the temporal response function of the pump-probe
setup. Figure 29.6d shows the time constant of the excimer formation as a function
of the peak wavelength of the excimer emission spectrum. By referring to the sizedependent fluorescence peak in the previous paper, the shift of the excimer emission
peak wavelength from 600 to 585 nm corresponds to a decreasing of the crystal
size from 300 to 100 nm. Therefore, it can be considered that the plot of the time
constant versus the peak wavelength in the figure will represent the size dependence.
Some single nanocrystals having the emission peak at the wavelength of shorter
than 595 nm showed the time constants of less than 1 ps, which means the faster
excimer formation in smaller nanocrystals. These results are the first demonstration