

29 Femtosecond Pump-Probe Microspectroscopy …
503
of the size-dependent excimer formation dynamics; i.e. energy trapping dynamics,
in organic nanocrystals, although the mechanism of the size effect is not cleared yet
at the present stage of the investigation.
Next, the exciton dynamics of copper phthnocyanine (CuPc) nanocrystals
is discussed. The femtosecond transient absorption spectroscopic studies were
reported by several research groups for polycrystalline thin solid films prepared
by vapor deposition, and the exciton-exciton annihilation under a dense excitation
condition was observed and discussed [23, 24]. Here, we present the results of CuPc
nanorods prepared by the laser ablation method [25]. CuPc nanorod colloids having
the dimensions of 40 nm in width and 100–1000 nm in length were prepared by ns
pulsed laser-induced fragmentation of its microcrystals dispersed in ethyl acetate.
We measured femtosecond transient absorption spectra for the nanorod colloid by
means of the conventional transient absorption spectroscopy and observed the transient absorption spectra having a strong positive, broad peak in the wavelength range
of 400–580 nm. The spectral shape was in good agreement with that in the thin film
of β-phase CuPc [24]. Also, the exciton decay dynamics depending on the excitation
intensity was similar to that of the thin film.
The CuPc nanorod colloids prepared by the laser fragmentation in liquid include
the nanorods of different crystalline phases. The β-phase nanorods are major product
and β-phase ones minor [25]. The α- and β-phase nanorods have absorption peaks
around 630 nm and 780 nm. The absorption peak ratio of 630 nm to 780 nm
was about 0.5 for α-phase nanorod, while the ratio was larger than 1 for β-phase
one. So, to examine the exciton dynamics of the nanorods depending on the crystalline phase, we measured exciton lifetimes and the steady-state scattering spectra of
individual 20 nanorods. The nanorods dispersed on a glass coverslip were used
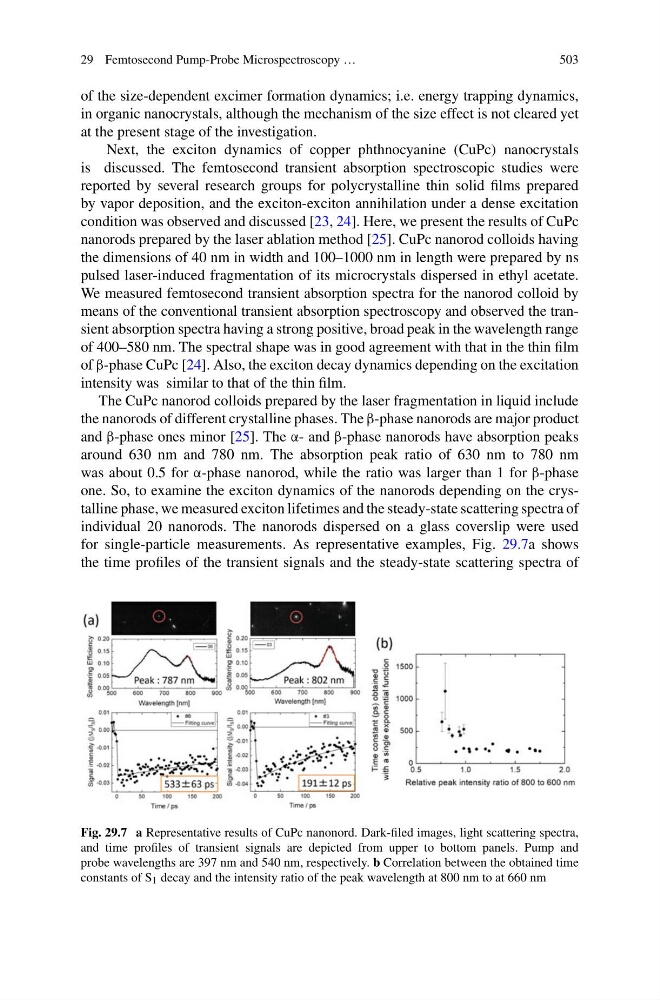
for single-particle measurements. As representative examples, Fig. 29.7a shows
the time profiles of the transient signals and the steady-state scattering spectra of
Fig. 29.7 a Representative results of CuPc nanonord. Dark-filed images, light scattering spectra,
and time profiles of transient signals are depicted from upper to bottom panels. Pump and
probe wavelengths are 397 nm and 540 nm, respectively. b Correlation between the obtained time
constants of S 1 decay and the intensity ratio of the peak wavelength at 800 nm to at 660 nm
503
of the size-dependent excimer formation dynamics; i.e. energy trapping dynamics,
in organic nanocrystals, although the mechanism of the size effect is not cleared yet
at the present stage of the investigation.
Next, the exciton dynamics of copper phthnocyanine (CuPc) nanocrystals
is discussed. The femtosecond transient absorption spectroscopic studies were
reported by several research groups for polycrystalline thin solid films prepared
by vapor deposition, and the exciton-exciton annihilation under a dense excitation
condition was observed and discussed [23, 24]. Here, we present the results of CuPc
nanorods prepared by the laser ablation method [25]. CuPc nanorod colloids having
the dimensions of 40 nm in width and 100–1000 nm in length were prepared by ns
pulsed laser-induced fragmentation of its microcrystals dispersed in ethyl acetate.
We measured femtosecond transient absorption spectra for the nanorod colloid by
means of the conventional transient absorption spectroscopy and observed the transient absorption spectra having a strong positive, broad peak in the wavelength range
of 400–580 nm. The spectral shape was in good agreement with that in the thin film
of β-phase CuPc [24]. Also, the exciton decay dynamics depending on the excitation
intensity was similar to that of the thin film.
The CuPc nanorod colloids prepared by the laser fragmentation in liquid include
the nanorods of different crystalline phases. The β-phase nanorods are major product
and β-phase ones minor [25]. The α- and β-phase nanorods have absorption peaks
around 630 nm and 780 nm. The absorption peak ratio of 630 nm to 780 nm
was about 0.5 for α-phase nanorod, while the ratio was larger than 1 for β-phase
one. So, to examine the exciton dynamics of the nanorods depending on the crystalline phase, we measured exciton lifetimes and the steady-state scattering spectra of
individual 20 nanorods. The nanorods dispersed on a glass coverslip were used
for single-particle measurements. As representative examples, Fig. 29.7a shows
the time profiles of the transient signals and the steady-state scattering spectra of
Fig. 29.7 a Representative results of CuPc nanonord. Dark-filed images, light scattering spectra,
and time profiles of transient signals are depicted from upper to bottom panels. Pump and
probe wavelengths are 397 nm and 540 nm, respectively. b Correlation between the obtained time
constants of S 1 decay and the intensity ratio of the peak wavelength at 800 nm to at 660 nm