

29 Femtosecond Pump-Probe Microspectroscopy …
501
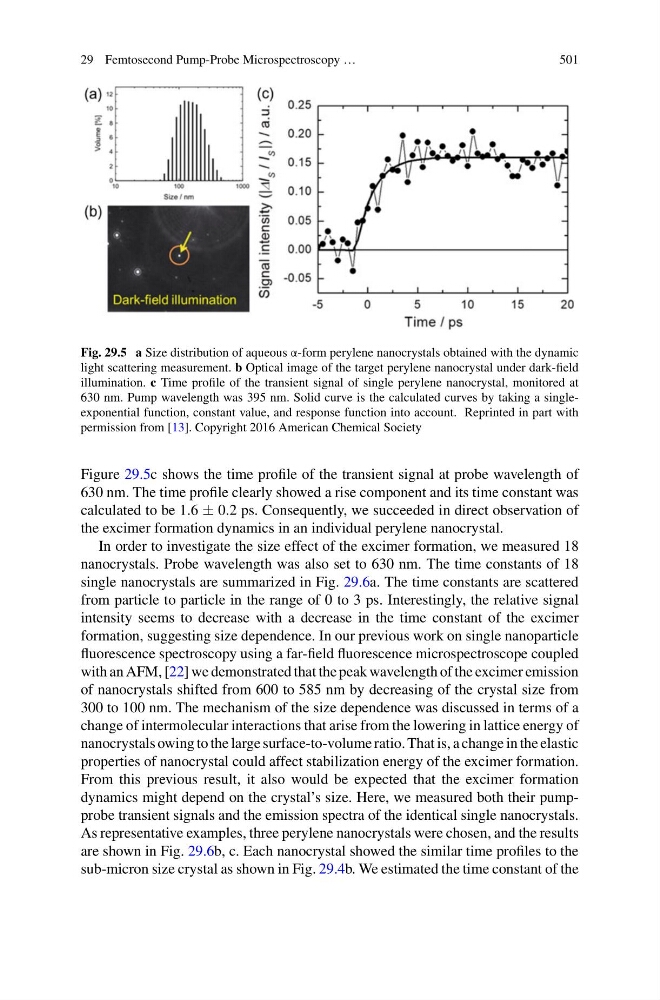
Fig. 29.5 a Size distribution of aqueous α-form perylene nanocrystals obtained with the dynamic
light scattering measurement. b Optical image of the target perylene nanocrystal under dark-field
illumination. c Time profile of the transient signal of single perylene nanocrystal, monitored at
630 nm. Pump wavelength was 395 nm. Solid curve is the calculated curves by taking a singleexponential function, constant value, and response function into account. Reprinted in part with
permission from [13]. Copyright 2016 American Chemical Society
Figure 29.5c shows the time profile of the transient signal at probe wavelength of
630 nm. The time profile clearly showed a rise component and its time constant was
calculated to be 1.6 ± 0.2 ps. Consequently, we succeeded in direct observation of
the excimer formation dynamics in an individual perylene nanocrystal.
In order to investigate the size effect of the excimer formation, we measured 18
nanocrystals. Probe wavelength was also set to 630 nm. The time constants of 18
single nanocrystals are summarized in Fig. 29.6a. The time constants are scattered
from particle to particle in the range of 0 to 3 ps. Interestingly, the relative signal
intensity seems to decrease with a decrease in the time constant of the excimer
formation, suggesting size dependence. In our previous work on single nanoparticle
fluorescence spectroscopy using a far-field fluorescence microspectroscope coupled
with an AFM, [22] we demonstrated that the peak wavelength of the excimer emission
of nanocrystals shifted from 600 to 585 nm by decreasing of the crystal size from
300 to 100 nm. The mechanism of the size dependence was discussed in terms of a
change of intermolecular interactions that arise from the lowering in lattice energy of
nanocrystals owing to the large surface-to-volume ratio. That is, a change in the elastic
properties of nanocrystal could affect stabilization energy of the excimer formation.
From this previous result, it also would be expected that the excimer formation
dynamics might depend on the crystal’s size. Here, we measured both their pumpprobe transient signals and the emission spectra of the identical single nanocrystals.
As representative examples, three perylene nanocrystals were chosen, and the results
are shown in Fig. 29.6b, c. Each nanocrystal showed the similar time profiles to the
sub-micron size crystal as shown in Fig. 29.4b. We estimated the time constant of the
501
Fig. 29.5 a Size distribution of aqueous α-form perylene nanocrystals obtained with the dynamic
light scattering measurement. b Optical image of the target perylene nanocrystal under dark-field
illumination. c Time profile of the transient signal of single perylene nanocrystal, monitored at
630 nm. Pump wavelength was 395 nm. Solid curve is the calculated curves by taking a singleexponential function, constant value, and response function into account. Reprinted in part with
permission from [13]. Copyright 2016 American Chemical Society
Figure 29.5c shows the time profile of the transient signal at probe wavelength of
630 nm. The time profile clearly showed a rise component and its time constant was
calculated to be 1.6 ± 0.2 ps. Consequently, we succeeded in direct observation of
the excimer formation dynamics in an individual perylene nanocrystal.
In order to investigate the size effect of the excimer formation, we measured 18
nanocrystals. Probe wavelength was also set to 630 nm. The time constants of 18
single nanocrystals are summarized in Fig. 29.6a. The time constants are scattered
from particle to particle in the range of 0 to 3 ps. Interestingly, the relative signal
intensity seems to decrease with a decrease in the time constant of the excimer
formation, suggesting size dependence. In our previous work on single nanoparticle
fluorescence spectroscopy using a far-field fluorescence microspectroscope coupled
with an AFM, [22] we demonstrated that the peak wavelength of the excimer emission
of nanocrystals shifted from 600 to 585 nm by decreasing of the crystal size from
300 to 100 nm. The mechanism of the size dependence was discussed in terms of a
change of intermolecular interactions that arise from the lowering in lattice energy of
nanocrystals owing to the large surface-to-volume ratio. That is, a change in the elastic
properties of nanocrystal could affect stabilization energy of the excimer formation.
From this previous result, it also would be expected that the excimer formation
dynamics might depend on the crystal’s size. Here, we measured both their pumpprobe transient signals and the emission spectra of the identical single nanocrystals.
As representative examples, three perylene nanocrystals were chosen, and the results
are shown in Fig. 29.6b, c. Each nanocrystal showed the similar time profiles to the
sub-micron size crystal as shown in Fig. 29.4b. We estimated the time constant of the