

500
Y. Ishibashi and T. Asahi
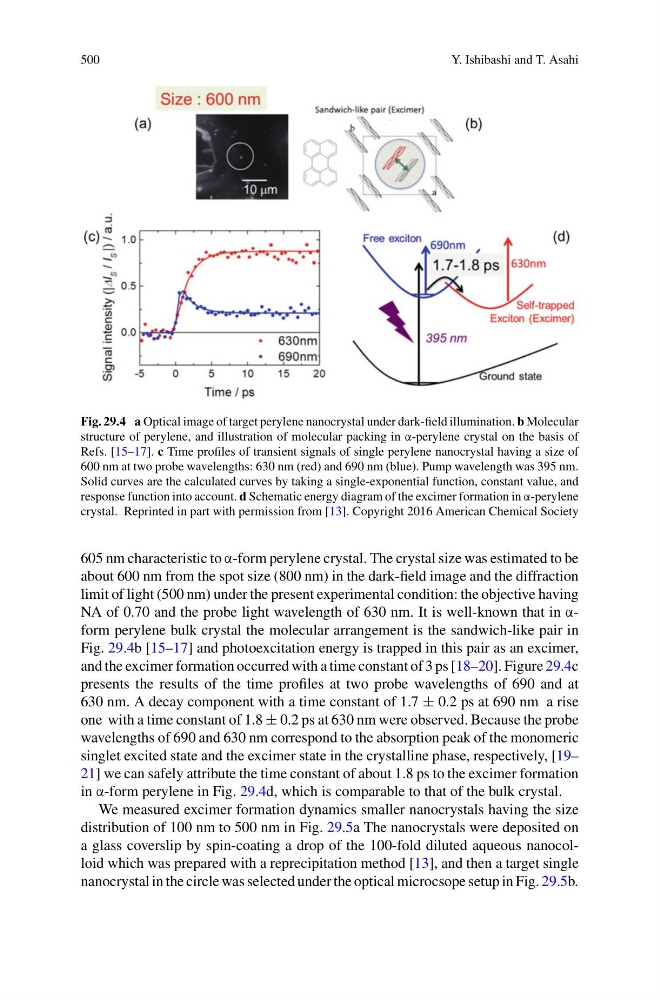
Fig. 29.4 a Optical image of target perylene nanocrystal under dark-field illumination. b Molecular
structure of perylene, and illustration of molecular packing in α-perylene crystal on the basis of
Refs. [15–17]. c Time profiles of transient signals of single perylene nanocrystal having a size of
600 nm at two probe wavelengths: 630 nm (red) and 690 nm (blue). Pump wavelength was 395 nm.
Solid curves are the calculated curves by taking a single-exponential function, constant value, and
response function into account. d Schematic energy diagram of the excimer formation in α-perylene
crystal. Reprinted in part with permission from [13]. Copyright 2016 American Chemical Society
605 nm characteristic to α-form perylene crystal. The crystal size was estimated to be
about 600 nm from the spot size (800 nm) in the dark-field image and the diffraction
limit of light (500 nm) under the present experimental condition: the objective having
NA of 0.70 and the probe light wavelength of 630 nm. It is well-known that in αform perylene bulk crystal the molecular arrangement is the sandwich-like pair in
Fig. 29.4b [15–17] and photoexcitation energy is trapped in this pair as an excimer,
and the excimer formation occurred with a time constant of 3 ps [18–20]. Figure 29.4c
presents the results of the time profiles at two probe wavelengths of 690 and at
630 nm. A decay component with a time constant of 1.7 ± 0.2 ps at 690 nm a rise
one with a time constant of 1.8 ± 0.2 ps at 630 nm were observed. Because the probe
wavelengths of 690 and 630 nm correspond to the absorption peak of the monomeric
singlet excited state and the excimer state in the crystalline phase, respectively, [19–
21] we can safely attribute the time constant of about 1.8 ps to the excimer formation
in α-form perylene in Fig. 29.4d, which is comparable to that of the bulk crystal.
We measured excimer formation dynamics smaller nanocrystals having the size
distribution of 100 nm to 500 nm in Fig. 29.5a The nanocrystals were deposited on
a glass coverslip by spin-coating a drop of the 100-fold diluted aqueous nanocolloid which was prepared with a reprecipitation method [13], and then a target single
nanocrystal in the circle was selected under the optical microcsope setup in Fig. 29.5b.
Y. Ishibashi and T. Asahi
Fig. 29.4 a Optical image of target perylene nanocrystal under dark-field illumination. b Molecular
structure of perylene, and illustration of molecular packing in α-perylene crystal on the basis of
Refs. [15–17]. c Time profiles of transient signals of single perylene nanocrystal having a size of
600 nm at two probe wavelengths: 630 nm (red) and 690 nm (blue). Pump wavelength was 395 nm.
Solid curves are the calculated curves by taking a single-exponential function, constant value, and
response function into account. d Schematic energy diagram of the excimer formation in α-perylene
crystal. Reprinted in part with permission from [13]. Copyright 2016 American Chemical Society
605 nm characteristic to α-form perylene crystal. The crystal size was estimated to be
about 600 nm from the spot size (800 nm) in the dark-field image and the diffraction
limit of light (500 nm) under the present experimental condition: the objective having
NA of 0.70 and the probe light wavelength of 630 nm. It is well-known that in αform perylene bulk crystal the molecular arrangement is the sandwich-like pair in
Fig. 29.4b [15–17] and photoexcitation energy is trapped in this pair as an excimer,
and the excimer formation occurred with a time constant of 3 ps [18–20]. Figure 29.4c
presents the results of the time profiles at two probe wavelengths of 690 and at
630 nm. A decay component with a time constant of 1.7 ± 0.2 ps at 690 nm a rise
one with a time constant of 1.8 ± 0.2 ps at 630 nm were observed. Because the probe
wavelengths of 690 and 630 nm correspond to the absorption peak of the monomeric
singlet excited state and the excimer state in the crystalline phase, respectively, [19–
21] we can safely attribute the time constant of about 1.8 ps to the excimer formation
in α-form perylene in Fig. 29.4d, which is comparable to that of the bulk crystal.
We measured excimer formation dynamics smaller nanocrystals having the size
distribution of 100 nm to 500 nm in Fig. 29.5a The nanocrystals were deposited on
a glass coverslip by spin-coating a drop of the 100-fold diluted aqueous nanocolloid which was prepared with a reprecipitation method [13], and then a target single
nanocrystal in the circle was selected under the optical microcsope setup in Fig. 29.5b.