

352
S. Saito
are well known as means for quantitatively analyzing the viscosity distribution. In
both methods, however, the so-called “molecular rotor” including BODIPY and
cyanine dyes has become widespread as a viscosity probe, and “molecular rotational
motion” in the excited state (S 1 ) is suppressed by a high-viscosity medium [8–14].
On the other hand, FLAP is a local viscosity probe that utilizes the “flapping motion
of molecules,” and it has dual fluorescence, so that it can be used as a fluorophore
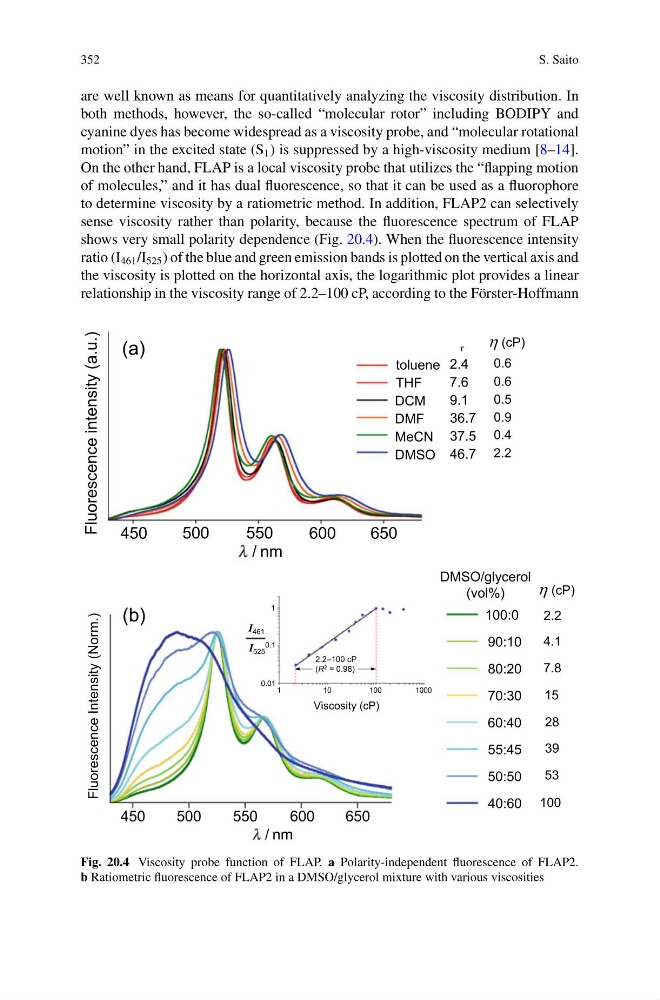
to determine viscosity by a ratiometric method. In addition, FLAP2 can selectively
sense viscosity rather than polarity, because the fluorescence spectrum of FLAP
shows very small polarity dependence (Fig. 20.4). When the fluorescence intensity
ratio (I 461 /I 525 ) of the blue and green emission bands is plotted on the vertical axis and
the viscosity is plotted on the horizontal axis, the logarithmic plot provides a linear
relationship in the viscosity range of 2.2–100 cP, according to the Förster-Hoffmann
Fig. 20.4 Viscosity probe function of FLAP. a Polarity-independent fluorescence of FLAP2.
b Ratiometric fluorescence of FLAP2 in a DMSO/glycerol mixture with various viscosities
S. Saito
are well known as means for quantitatively analyzing the viscosity distribution. In
both methods, however, the so-called “molecular rotor” including BODIPY and
cyanine dyes has become widespread as a viscosity probe, and “molecular rotational
motion” in the excited state (S 1 ) is suppressed by a high-viscosity medium [8–14].
On the other hand, FLAP is a local viscosity probe that utilizes the “flapping motion
of molecules,” and it has dual fluorescence, so that it can be used as a fluorophore
to determine viscosity by a ratiometric method. In addition, FLAP2 can selectively
sense viscosity rather than polarity, because the fluorescence spectrum of FLAP
shows very small polarity dependence (Fig. 20.4). When the fluorescence intensity
ratio (I 461 /I 525 ) of the blue and green emission bands is plotted on the vertical axis and
the viscosity is plotted on the horizontal axis, the logarithmic plot provides a linear
relationship in the viscosity range of 2.2–100 cP, according to the Förster-Hoffmann
Fig. 20.4 Viscosity probe function of FLAP. a Polarity-independent fluorescence of FLAP2.
b Ratiometric fluorescence of FLAP2 in a DMSO/glycerol mixture with various viscosities