

18 π-Electronic Ion-Pairing Assemblies …
321
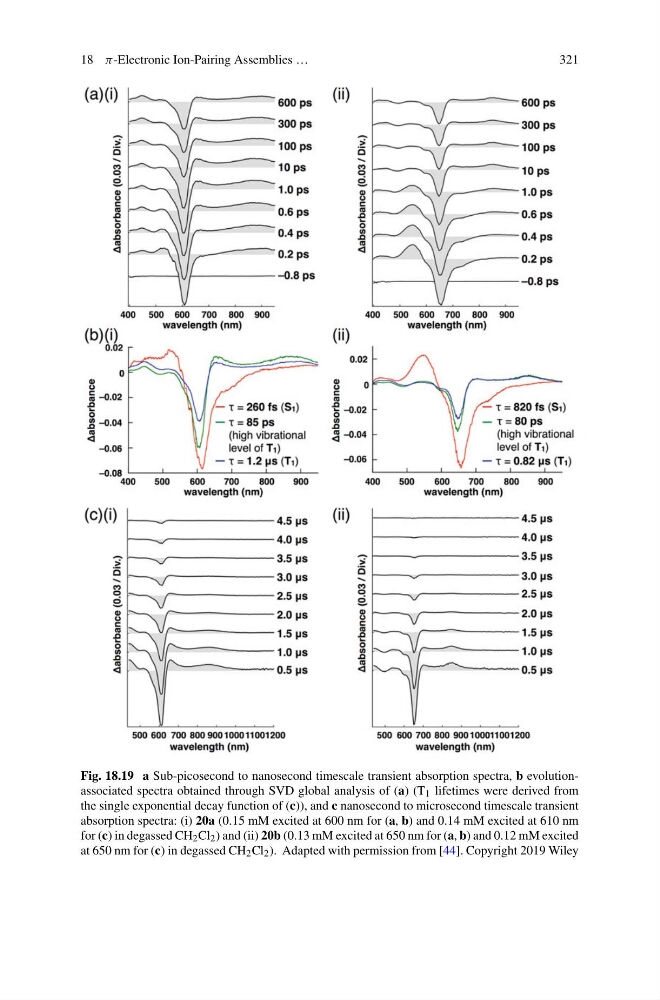
Fig. 18.19 a Sub-picosecond to nanosecond timescale transient absorption spectra, b evolutionassociated spectra obtained through SVD global analysis of (a) (T 1 lifetimes were derived from
the single exponential decay function of (c)), and c nanosecond to microsecond timescale transient
absorption spectra: (i) 20a (0.15 mM excited at 600 nm for (a, b) and 0.14 mM excited at 610 nm
for (c) in degassed CH 2 Cl 2 ) and (ii) 20b (0.13 mM excited at 650 nm for (a, b) and 0.12 mM excited
at 650 nm for (c) in degassed CH 2 Cl 2 ). Adapted with permission from [44]. Copyright 2019 Wiley
321
Fig. 18.19 a Sub-picosecond to nanosecond timescale transient absorption spectra, b evolutionassociated spectra obtained through SVD global analysis of (a) (T 1 lifetimes were derived from
the single exponential decay function of (c)), and c nanosecond to microsecond timescale transient
absorption spectra: (i) 20a (0.15 mM excited at 600 nm for (a, b) and 0.14 mM excited at 610 nm
for (c) in degassed CH 2 Cl 2 ) and (ii) 20b (0.13 mM excited at 650 nm for (a, b) and 0.12 mM excited
at 650 nm for (c) in degassed CH 2 Cl 2 ). Adapted with permission from [44]. Copyright 2019 Wiley