

280
T. Hasobe
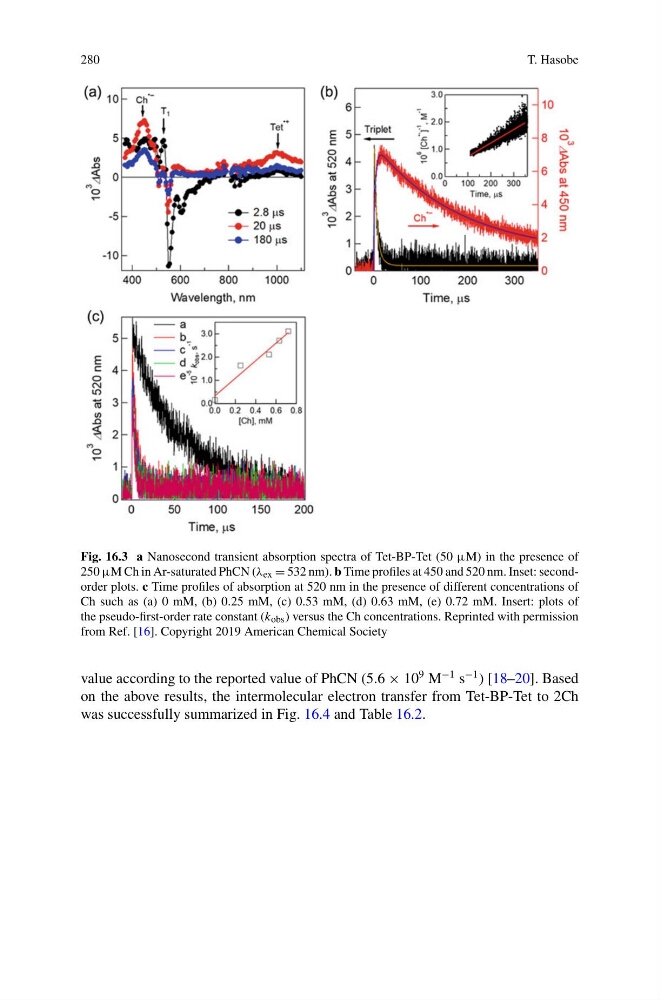
Fig. 16.3 a Nanosecond transient absorption spectra of Tet-BP-Tet (50 µM) in the presence of
250 µM Ch in Ar-saturated PhCN (λ ex = 532 nm). b Time profiles at 450 and 520 nm. Inset: secondorder plots. c Time profiles of absorption at 520 nm in the presence of different concentrations of
Ch such as (a) 0 mM, (b) 0.25 mM, (c) 0.53 mM, (d) 0.63 mM, (e) 0.72 mM. Insert: plots of
the pseudo-first-order rate constant (k obs ) versus the Ch concentrations. Reprinted with permission
from Ref. [16]. Copyright 2019 American Chemical Society
value according to the reported value of PhCN (5.6 × 10
9 M
−1 s
−1 ) [18–20]. Based
on the above results, the intermolecular electron transfer from Tet-BP-Tet to 2Ch
was successfully summarized in Fig. 16.4 and Table 16.2.
T. Hasobe
Fig. 16.3 a Nanosecond transient absorption spectra of Tet-BP-Tet (50 µM) in the presence of
250 µM Ch in Ar-saturated PhCN (λ ex = 532 nm). b Time profiles at 450 and 520 nm. Inset: secondorder plots. c Time profiles of absorption at 520 nm in the presence of different concentrations of
Ch such as (a) 0 mM, (b) 0.25 mM, (c) 0.53 mM, (d) 0.63 mM, (e) 0.72 mM. Insert: plots of
the pseudo-first-order rate constant (k obs ) versus the Ch concentrations. Reprinted with permission
from Ref. [16]. Copyright 2019 American Chemical Society
value according to the reported value of PhCN (5.6 × 10
9 M
−1 s
−1 ) [18–20]. Based
on the above results, the intermolecular electron transfer from Tet-BP-Tet to 2Ch
was successfully summarized in Fig. 16.4 and Table 16.2.