

1 Advanced Control of Photochemical Reactions …
13
With an increase in the time interval in sub-ps to several ps time region, the
negative signal of Absorbance appears with the time constants of 100 fs and
4 ps, indicating the enhancement of the cycloreversion reaction. The former time
constant of 100 fs is the same with that of the interconversion from the Franck–
Condon 1B state to the subsequent 2A sate, as was shown in the previous section.
On the other hand, the latter time constant, 4 ps, is slightly longer than that of the
geometrical rearrangement in one-photon cycloreversion reaction dynamics. This
difference might be related to the reaction probability in the higher excited state being
more sensitive to the geometry. That is, the correlation curve between the reaction
amount and t in Fig. 1.11 involves the reaction probability in the higher excited
state, while the time evolution of the transient absorption in Fig. 1.11 represents the
S 1 state dynamics. At and after ca. 6 ps, the signal gradually decreases due to the
decay of the 2A state with the time constant of 10 ps. These results in Fig. 1.11
clearly show that the excitation of the 2A state leads to the enhancement of the
cycloreversion reaction while the excitation of the 1B state results in the suppression
of the cycloreversion reaction. In addition, the photoexcitation of the geometrically
relaxed 2A state more efficiently leads to the cycloreversion reaction.
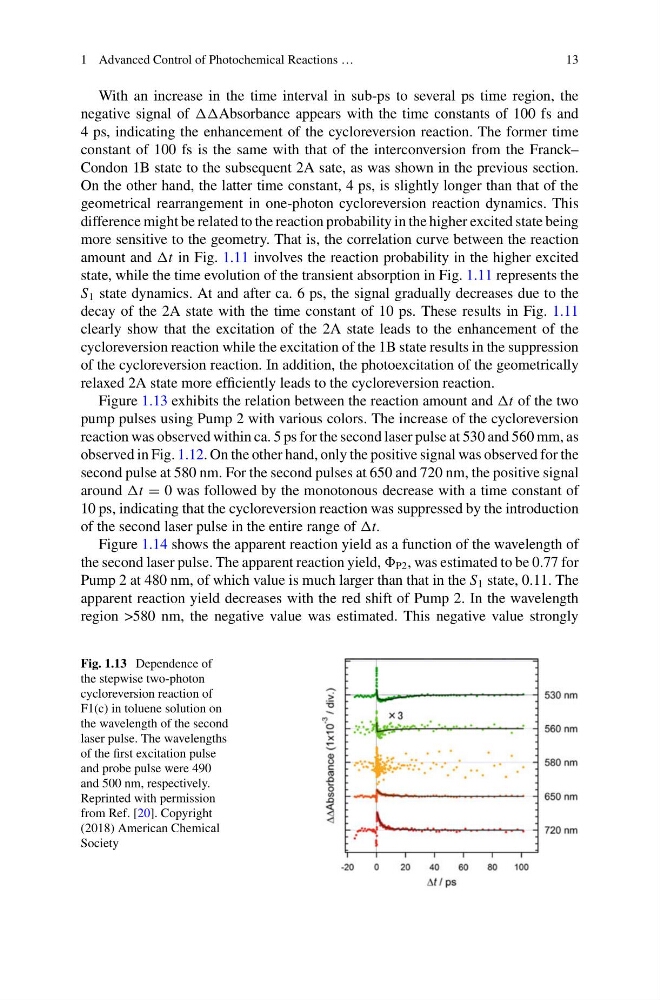
Figure 1.13 exhibits the relation between the reaction amount and t of the two
pump pulses using Pump 2 with various colors. The increase of the cycloreversion
reaction was observed within ca. 5 ps for the second laser pulse at 530 and 560 mm, as
observed in Fig. 1.12. On the other hand, only the positive signal was observed for the
second pulse at 580 nm. For the second pulses at 650 and 720 nm, the positive signal
around t = 0 was followed by the monotonous decrease with a time constant of
10 ps, indicating that the cycloreversion reaction was suppressed by the introduction
of the second laser pulse in the entire range of t.
Figure 1.14 shows the apparent reaction yield as a function of the wavelength of
the second laser pulse. The apparent reaction yield, P2 , was estimated to be 0.77 for
Pump 2 at 480 nm, of which value is much larger than that in the S 1 state, 0.11. The
apparent reaction yield decreases with the red shift of Pump 2. In the wavelength
region >580 nm, the negative value was estimated. This negative value strongly
Fig. 1.13 Dependence of
the stepwise two-photon
cycloreversion reaction of
F1(c) in toluene solution on
the wavelength of the second
laser pulse. The wavelengths
of the first excitation pulse
and probe pulse were 490
and 500 nm, respectively.
Reprinted with permission
from Ref. [20]. Copyright
(2018) American Chemical
Society
13
With an increase in the time interval in sub-ps to several ps time region, the
negative signal of Absorbance appears with the time constants of 100 fs and
4 ps, indicating the enhancement of the cycloreversion reaction. The former time
constant of 100 fs is the same with that of the interconversion from the Franck–
Condon 1B state to the subsequent 2A sate, as was shown in the previous section.
On the other hand, the latter time constant, 4 ps, is slightly longer than that of the
geometrical rearrangement in one-photon cycloreversion reaction dynamics. This
difference might be related to the reaction probability in the higher excited state being
more sensitive to the geometry. That is, the correlation curve between the reaction
amount and t in Fig. 1.11 involves the reaction probability in the higher excited
state, while the time evolution of the transient absorption in Fig. 1.11 represents the
S 1 state dynamics. At and after ca. 6 ps, the signal gradually decreases due to the
decay of the 2A state with the time constant of 10 ps. These results in Fig. 1.11
clearly show that the excitation of the 2A state leads to the enhancement of the
cycloreversion reaction while the excitation of the 1B state results in the suppression
of the cycloreversion reaction. In addition, the photoexcitation of the geometrically
relaxed 2A state more efficiently leads to the cycloreversion reaction.
Figure 1.13 exhibits the relation between the reaction amount and t of the two
pump pulses using Pump 2 with various colors. The increase of the cycloreversion
reaction was observed within ca. 5 ps for the second laser pulse at 530 and 560 mm, as
observed in Fig. 1.12. On the other hand, only the positive signal was observed for the
second pulse at 580 nm. For the second pulses at 650 and 720 nm, the positive signal
around t = 0 was followed by the monotonous decrease with a time constant of
10 ps, indicating that the cycloreversion reaction was suppressed by the introduction
of the second laser pulse in the entire range of t.
Figure 1.14 shows the apparent reaction yield as a function of the wavelength of
the second laser pulse. The apparent reaction yield, P2 , was estimated to be 0.77 for
Pump 2 at 480 nm, of which value is much larger than that in the S 1 state, 0.11. The
apparent reaction yield decreases with the red shift of Pump 2. In the wavelength
region >580 nm, the negative value was estimated. This negative value strongly
Fig. 1.13 Dependence of
the stepwise two-photon
cycloreversion reaction of
F1(c) in toluene solution on
the wavelength of the second
laser pulse. The wavelengths
of the first excitation pulse
and probe pulse were 490
and 500 nm, respectively.
Reprinted with permission
from Ref. [20]. Copyright
(2018) American Chemical
Society