

190
N. Tamai and S. Masuo
Fig. 10.15 (continued)
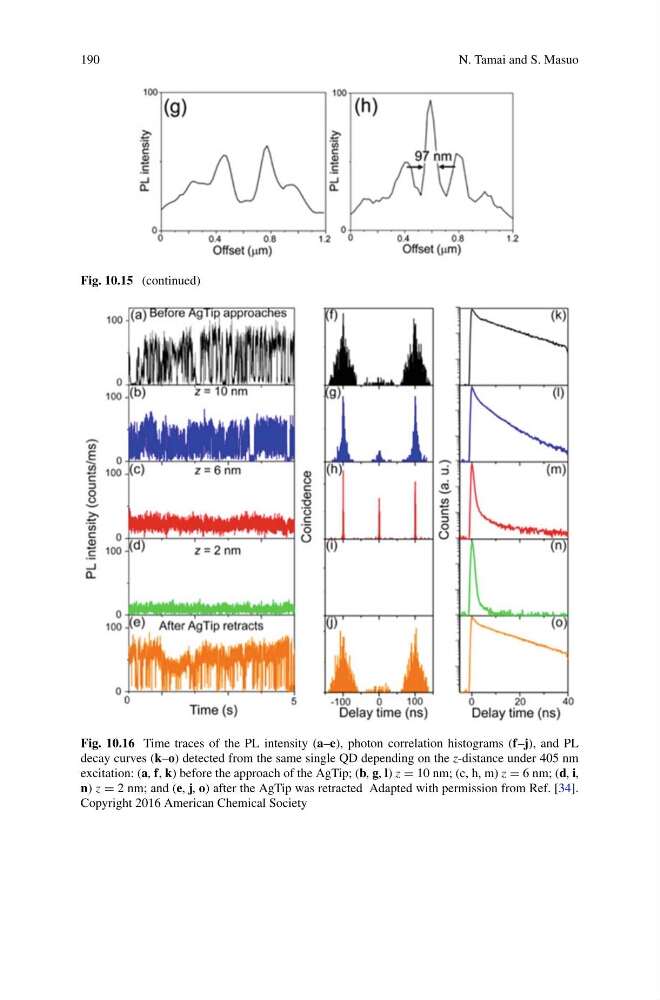
Fig. 10.16 Time traces of the PL intensity (a–e), photon correlation histograms (f–j), and PL
decay curves (k–o) detected from the same single QD depending on the z-distance under 405 nm
excitation: (a, f, k) before the approach of the AgTip; (b, g, l) z = 10 nm; (c, h, m) z = 6 nm; (d, i,
n) z = 2 nm; and (e, j, o) after the AgTip was retracted Adapted with permission from Ref. [34].
Copyright 2016 American Chemical Society
N. Tamai and S. Masuo
Fig. 10.15 (continued)
Fig. 10.16 Time traces of the PL intensity (a–e), photon correlation histograms (f–j), and PL
decay curves (k–o) detected from the same single QD depending on the z-distance under 405 nm
excitation: (a, f, k) before the approach of the AgTip; (b, g, l) z = 10 nm; (c, h, m) z = 6 nm; (d, i,
n) z = 2 nm; and (e, j, o) after the AgTip was retracted Adapted with permission from Ref. [34].
Copyright 2016 American Chemical Society