

10 Hot Carrier Transfer and Carrier Manipulation of Semiconductor …
191
the efficient quenching of the SX of the QD is the mechanism for the increase in the
probability of the multiphoton emission.
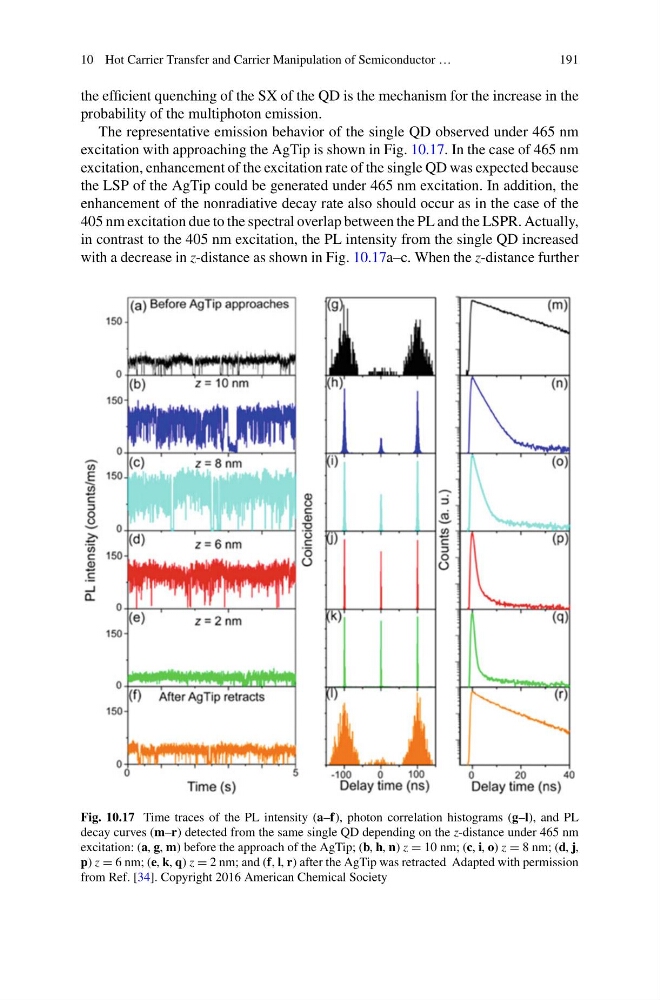
The representative emission behavior of the single QD observed under 465 nm
excitation with approaching the AgTip is shown in Fig. 10.17. In the case of 465 nm
excitation, enhancement of the excitation rate of the single QD was expected because
the LSP of the AgTip could be generated under 465 nm excitation. In addition, the
enhancement of the nonradiative decay rate also should occur as in the case of the
405 nm excitation due to the spectral overlap between the PL and the LSPR. Actually,
in contrast to the 405 nm excitation, the PL intensity from the single QD increased
with a decrease in z-distance as shown in Fig. 10.17a–c. When the z-distance further
Fig. 10.17 Time traces of the PL intensity (a–f), photon correlation histograms (g–l), and PL
decay curves (m–r) detected from the same single QD depending on the z-distance under 465 nm
excitation: (a, g, m) before the approach of the AgTip; (b, h, n) z = 10 nm; (c, i, o) z = 8 nm; (d, j,
p) z = 6 nm; (e, k, q) z = 2 nm; and (f, l, r) after the AgTip was retracted Adapted with permission
from Ref. [34]. Copyright 2016 American Chemical Society
191
the efficient quenching of the SX of the QD is the mechanism for the increase in the
probability of the multiphoton emission.
The representative emission behavior of the single QD observed under 465 nm
excitation with approaching the AgTip is shown in Fig. 10.17. In the case of 465 nm
excitation, enhancement of the excitation rate of the single QD was expected because
the LSP of the AgTip could be generated under 465 nm excitation. In addition, the
enhancement of the nonradiative decay rate also should occur as in the case of the
405 nm excitation due to the spectral overlap between the PL and the LSPR. Actually,
in contrast to the 405 nm excitation, the PL intensity from the single QD increased
with a decrease in z-distance as shown in Fig. 10.17a–c. When the z-distance further
Fig. 10.17 Time traces of the PL intensity (a–f), photon correlation histograms (g–l), and PL
decay curves (m–r) detected from the same single QD depending on the z-distance under 465 nm
excitation: (a, g, m) before the approach of the AgTip; (b, h, n) z = 10 nm; (c, i, o) z = 8 nm; (d, j,
p) z = 6 nm; (e, k, q) z = 2 nm; and (f, l, r) after the AgTip was retracted Adapted with permission
from Ref. [34]. Copyright 2016 American Chemical Society