

10 Hot Carrier Transfer and Carrier Manipulation of Semiconductor …
181
CdSe QD-Au HNs, suggesting the existence of efficient electron transfer from CdSe
QDs to Au NPs. State-selective transient absorption spectroscopy was used to reveal
the electron transfer mechanism from CdSe QDs to Au NPs, in which HNs were
excited at 574, 555, and 496 nm as well as 400 nm, corresponding to the selective
excitation of 1S(e)-1S 3/2 (h) (1S), 1S(e)-2S 3/2 (h) (2S), and 1P(e)-1P 3/2 (h) (1P) as
illustrated in Fig. 10.8b, respectively.
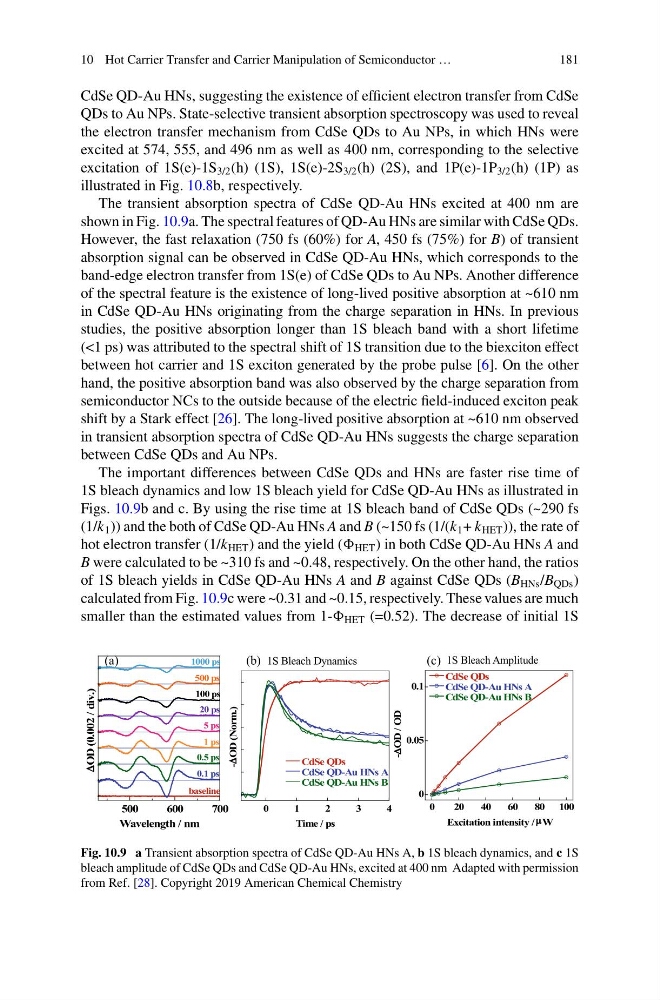
The transient absorption spectra of CdSe QD-Au HNs excited at 400 nm are
shown in Fig. 10.9a. The spectral features of QD-Au HNs are similar with CdSe QDs.
However, the fast relaxation (750 fs (60%) for A, 450 fs (75%) for B) of transient
absorption signal can be observed in CdSe QD-Au HNs, which corresponds to the
band-edge electron transfer from 1S(e) of CdSe QDs to Au NPs. Another difference
of the spectral feature is the existence of long-lived positive absorption at ~610 nm
in CdSe QD-Au HNs originating from the charge separation in HNs. In previous
studies, the positive absorption longer than 1S bleach band with a short lifetime
(<1 ps) was attributed to the spectral shift of 1S transition due to the biexciton effect
between hot carrier and 1S exciton generated by the probe pulse [6]. On the other
hand, the positive absorption band was also observed by the charge separation from
semiconductor NCs to the outside because of the electric field-induced exciton peak
shift by a Stark effect [26]. The long-lived positive absorption at ~610 nm observed
in transient absorption spectra of CdSe QD-Au HNs suggests the charge separation
between CdSe QDs and Au NPs.
The important differences between CdSe QDs and HNs are faster rise time of
1S bleach dynamics and low 1S bleach yield for CdSe QD-Au HNs as illustrated in
Figs. 10.9b and c. By using the rise time at 1S bleach band of CdSe QDs (~290 fs
(1/k 1 )) and the both of CdSe QD-Au HNs A and B (~150 fs (1/(k 1 + k HET )), the rate of
hot electron transfer (1/k HET ) and the yield ( HET ) in both CdSe QD-Au HNs A and
B were calculated to be ~310 fs and ~0.48, respectively. On the other hand, the ratios
of 1S bleach yields in CdSe QD-Au HNs A and B against CdSe QDs (B HNs /B QDs )
calculated from Fig. 10.9c were ~0.31 and ~0.15, respectively. These values are much
smaller than the estimated values from 1- HET (=0.52). The decrease of initial 1S
0
1
2
3
4
CdSe QDs
CdSe QD-Au HNs A
CdSe QD-Au HNs B
- OD (Norm.)
Time / ps
1S Bleach Dynamics
0
0.05
0.1
0
20
40
60
80 100
CdSe QDs
CdSe QD-Au HNs A
CdSe QD-Au HNs B
- OD / OD
Excitation intensity / W
1S Bleach Amplitude
(a)
(b)
(c)
500
600
700
OD (0.002 / div.)
Wavelength / nm
baseline
0.1 ps
0.5 ps
1 ps
5 ps
20 ps
100 ps
500 ps
1000 ps
Fig. 10.9 a Transient absorption spectra of CdSe QD-Au HNs A, b 1S bleach dynamics, and c 1S
bleach amplitude of CdSe QDs and CdSe QD-Au HNs, excited at 400 nm Adapted with permission
from Ref. [28]. Copyright 2019 American Chemical Chemistry
181
CdSe QD-Au HNs, suggesting the existence of efficient electron transfer from CdSe
QDs to Au NPs. State-selective transient absorption spectroscopy was used to reveal
the electron transfer mechanism from CdSe QDs to Au NPs, in which HNs were
excited at 574, 555, and 496 nm as well as 400 nm, corresponding to the selective
excitation of 1S(e)-1S 3/2 (h) (1S), 1S(e)-2S 3/2 (h) (2S), and 1P(e)-1P 3/2 (h) (1P) as
illustrated in Fig. 10.8b, respectively.
The transient absorption spectra of CdSe QD-Au HNs excited at 400 nm are
shown in Fig. 10.9a. The spectral features of QD-Au HNs are similar with CdSe QDs.
However, the fast relaxation (750 fs (60%) for A, 450 fs (75%) for B) of transient
absorption signal can be observed in CdSe QD-Au HNs, which corresponds to the
band-edge electron transfer from 1S(e) of CdSe QDs to Au NPs. Another difference
of the spectral feature is the existence of long-lived positive absorption at ~610 nm
in CdSe QD-Au HNs originating from the charge separation in HNs. In previous
studies, the positive absorption longer than 1S bleach band with a short lifetime
(<1 ps) was attributed to the spectral shift of 1S transition due to the biexciton effect
between hot carrier and 1S exciton generated by the probe pulse [6]. On the other
hand, the positive absorption band was also observed by the charge separation from
semiconductor NCs to the outside because of the electric field-induced exciton peak
shift by a Stark effect [26]. The long-lived positive absorption at ~610 nm observed
in transient absorption spectra of CdSe QD-Au HNs suggests the charge separation
between CdSe QDs and Au NPs.
The important differences between CdSe QDs and HNs are faster rise time of
1S bleach dynamics and low 1S bleach yield for CdSe QD-Au HNs as illustrated in
Figs. 10.9b and c. By using the rise time at 1S bleach band of CdSe QDs (~290 fs
(1/k 1 )) and the both of CdSe QD-Au HNs A and B (~150 fs (1/(k 1 + k HET )), the rate of
hot electron transfer (1/k HET ) and the yield ( HET ) in both CdSe QD-Au HNs A and
B were calculated to be ~310 fs and ~0.48, respectively. On the other hand, the ratios
of 1S bleach yields in CdSe QD-Au HNs A and B against CdSe QDs (B HNs /B QDs )
calculated from Fig. 10.9c were ~0.31 and ~0.15, respectively. These values are much
smaller than the estimated values from 1- HET (=0.52). The decrease of initial 1S
0
1
2
3
4
CdSe QDs
CdSe QD-Au HNs A
CdSe QD-Au HNs B
- OD (Norm.)
Time / ps
1S Bleach Dynamics
0
0.05
0.1
0
20
40
60
80 100
CdSe QDs
CdSe QD-Au HNs A
CdSe QD-Au HNs B
- OD / OD
Excitation intensity / W
1S Bleach Amplitude
(a)
(b)
(c)
500
600
700
OD (0.002 / div.)
Wavelength / nm
baseline
0.1 ps
0.5 ps
1 ps
5 ps
20 ps
100 ps
500 ps
1000 ps
Fig. 10.9 a Transient absorption spectra of CdSe QD-Au HNs A, b 1S bleach dynamics, and c 1S
bleach amplitude of CdSe QDs and CdSe QD-Au HNs, excited at 400 nm Adapted with permission
from Ref. [28]. Copyright 2019 American Chemical Chemistry