

154
K. Kamada et al.
which shows the potential of these fabrication methods. The ring-like emission shows
the UC-luminescent particles are located in the rim.
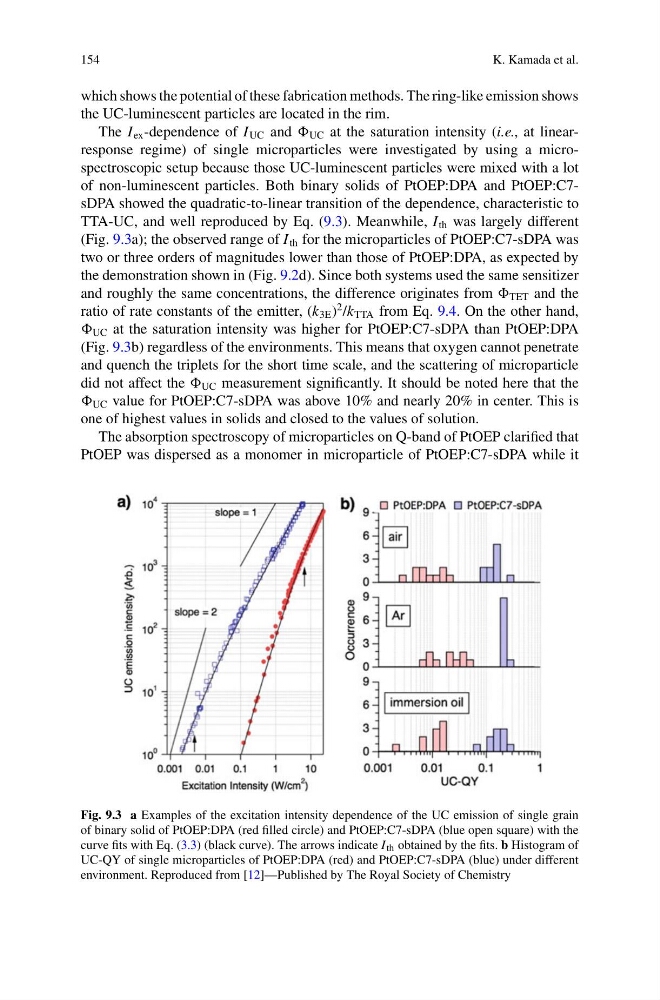
The I ex -dependence of I UC and UC at the saturation intensity (i.e., at linearresponse regime) of single microparticles were investigated by using a microspectroscopic setup because those UC-luminescent particles were mixed with a lot
of non-luminescent particles. Both binary solids of PtOEP:DPA and PtOEP:C7sDPA showed the quadratic-to-linear transition of the dependence, characteristic to
TTA-UC, and well reproduced by Eq. (9.3). Meanwhile, I th was largely different
(Fig. 9.3a); the observed range of I th for the microparticles of PtOEP:C7-sDPA was
two or three orders of magnitudes lower than those of PtOEP:DPA, as expected by
the demonstration shown in (Fig. 9.2d). Since both systems used the same sensitizer
and roughly the same concentrations, the difference originates from TET and the
ratio of rate constants of the emitter, (k 3E )
2 /k TTA from Eq. 9.4. On the other hand,
UC at the saturation intensity was higher for PtOEP:C7-sDPA than PtOEP:DPA
(Fig. 9.3b) regardless of the environments. This means that oxygen cannot penetrate
and quench the triplets for the short time scale, and the scattering of microparticle
did not affect the UC measurement significantly. It should be noted here that the
UC value for PtOEP:C7-sDPA was above 10% and nearly 20% in center. This is
one of highest values in solids and closed to the values of solution.
The absorption spectroscopy of microparticles on Q-band of PtOEP clarified that
PtOEP was dispersed as a monomer in microparticle of PtOEP:C7-sDPA while it
Fig. 9.3 a Examples of the excitation intensity dependence of the UC emission of single grain
of binary solid of PtOEP:DPA (red filled circle) and PtOEP:C7-sDPA (blue open square) with the
curve fits with Eq. (3.3) (black curve). The arrows indicate I th obtained by the fits. b Histogram of
UC-QY of single microparticles of PtOEP:DPA (red) and PtOEP:C7-sDPA (blue) under different
environment. Reproduced from [12]—Published by The Royal Society of Chemistry
K. Kamada et al.
which shows the potential of these fabrication methods. The ring-like emission shows
the UC-luminescent particles are located in the rim.
The I ex -dependence of I UC and UC at the saturation intensity (i.e., at linearresponse regime) of single microparticles were investigated by using a microspectroscopic setup because those UC-luminescent particles were mixed with a lot
of non-luminescent particles. Both binary solids of PtOEP:DPA and PtOEP:C7sDPA showed the quadratic-to-linear transition of the dependence, characteristic to
TTA-UC, and well reproduced by Eq. (9.3). Meanwhile, I th was largely different
(Fig. 9.3a); the observed range of I th for the microparticles of PtOEP:C7-sDPA was
two or three orders of magnitudes lower than those of PtOEP:DPA, as expected by
the demonstration shown in (Fig. 9.2d). Since both systems used the same sensitizer
and roughly the same concentrations, the difference originates from TET and the
ratio of rate constants of the emitter, (k 3E )
2 /k TTA from Eq. 9.4. On the other hand,
UC at the saturation intensity was higher for PtOEP:C7-sDPA than PtOEP:DPA
(Fig. 9.3b) regardless of the environments. This means that oxygen cannot penetrate
and quench the triplets for the short time scale, and the scattering of microparticle
did not affect the UC measurement significantly. It should be noted here that the
UC value for PtOEP:C7-sDPA was above 10% and nearly 20% in center. This is
one of highest values in solids and closed to the values of solution.
The absorption spectroscopy of microparticles on Q-band of PtOEP clarified that
PtOEP was dispersed as a monomer in microparticle of PtOEP:C7-sDPA while it
Fig. 9.3 a Examples of the excitation intensity dependence of the UC emission of single grain
of binary solid of PtOEP:DPA (red filled circle) and PtOEP:C7-sDPA (blue open square) with the
curve fits with Eq. (3.3) (black curve). The arrows indicate I th obtained by the fits. b Histogram of
UC-QY of single microparticles of PtOEP:DPA (red) and PtOEP:C7-sDPA (blue) under different
environment. Reproduced from [12]—Published by The Royal Society of Chemistry