

8 Modulations of Electronic States in Plasmonic Strong Coupling …
137
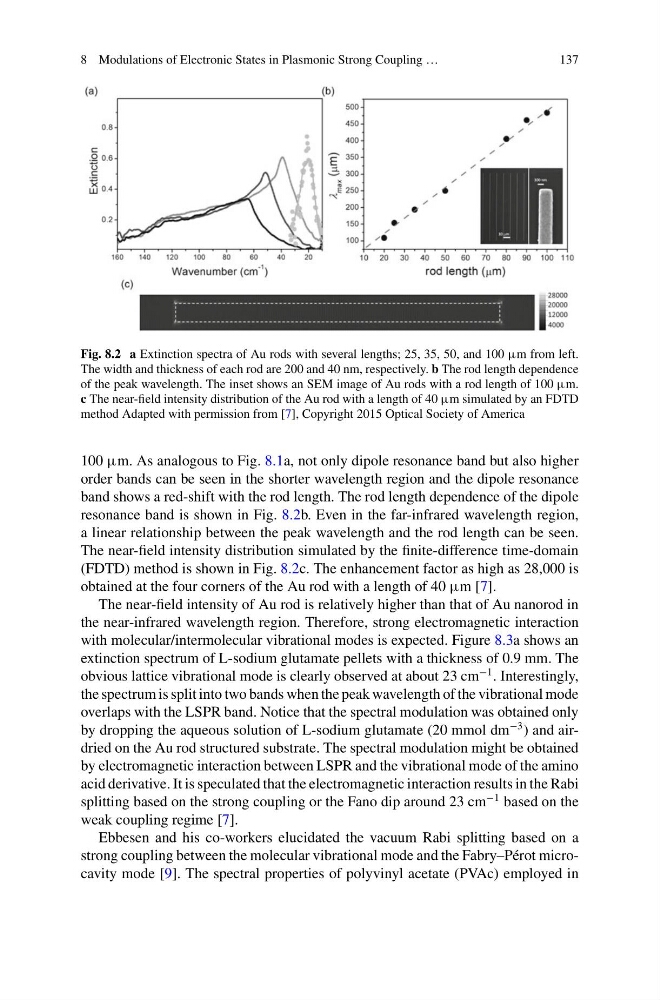
Fig. 8.2 a Extinction spectra of Au rods with several lengths; 25, 35, 50, and 100 µm from left.
The width and thickness of each rod are 200 and 40 nm, respectively. b The rod length dependence
of the peak wavelength. The inset shows an SEM image of Au rods with a rod length of 100 µm.
c The near-field intensity distribution of the Au rod with a length of 40 µm simulated by an FDTD
method Adapted with permission from [7], Copyright 2015 Optical Society of America
100 µm. As analogous to Fig. 8.1a, not only dipole resonance band but also higher
order bands can be seen in the shorter wavelength region and the dipole resonance
band shows a red-shift with the rod length. The rod length dependence of the dipole
resonance band is shown in Fig. 8.2b. Even in the far-infrared wavelength region,
a linear relationship between the peak wavelength and the rod length can be seen.
The near-field intensity distribution simulated by the finite-difference time-domain
(FDTD) method is shown in Fig. 8.2c. The enhancement factor as high as 28,000 is
obtained at the four corners of the Au rod with a length of 40 µm [7].
The near-field intensity of Au rod is relatively higher than that of Au nanorod in
the near-infrared wavelength region. Therefore, strong electromagnetic interaction
with molecular/intermolecular vibrational modes is expected. Figure 8.3a shows an
extinction spectrum of L-sodium glutamate pellets with a thickness of 0.9 mm. The
obvious lattice vibrational mode is clearly observed at about 23 cm
−1 . Interestingly,
the spectrum is split into two bands when the peak wavelength of the vibrational mode
overlaps with the LSPR band. Notice that the spectral modulation was obtained only
by dropping the aqueous solution of L-sodium glutamate (20 mmol dm
−3 ) and airdried on the Au rod structured substrate. The spectral modulation might be obtained
by electromagnetic interaction between LSPR and the vibrational mode of the amino
acid derivative. It is speculated that the electromagnetic interaction results in the Rabi
splitting based on the strong coupling or the Fano dip around 23 cm
−1 based on the
weak coupling regime [7].
Ebbesen and his co-workers elucidated the vacuum Rabi splitting based on a
strong coupling between the molecular vibrational mode and the Fabry–Pérot microcavity mode [9]. The spectral properties of polyvinyl acetate (PVAc) employed in
137
Fig. 8.2 a Extinction spectra of Au rods with several lengths; 25, 35, 50, and 100 µm from left.
The width and thickness of each rod are 200 and 40 nm, respectively. b The rod length dependence
of the peak wavelength. The inset shows an SEM image of Au rods with a rod length of 100 µm.
c The near-field intensity distribution of the Au rod with a length of 40 µm simulated by an FDTD
method Adapted with permission from [7], Copyright 2015 Optical Society of America
100 µm. As analogous to Fig. 8.1a, not only dipole resonance band but also higher
order bands can be seen in the shorter wavelength region and the dipole resonance
band shows a red-shift with the rod length. The rod length dependence of the dipole
resonance band is shown in Fig. 8.2b. Even in the far-infrared wavelength region,
a linear relationship between the peak wavelength and the rod length can be seen.
The near-field intensity distribution simulated by the finite-difference time-domain
(FDTD) method is shown in Fig. 8.2c. The enhancement factor as high as 28,000 is
obtained at the four corners of the Au rod with a length of 40 µm [7].
The near-field intensity of Au rod is relatively higher than that of Au nanorod in
the near-infrared wavelength region. Therefore, strong electromagnetic interaction
with molecular/intermolecular vibrational modes is expected. Figure 8.3a shows an
extinction spectrum of L-sodium glutamate pellets with a thickness of 0.9 mm. The
obvious lattice vibrational mode is clearly observed at about 23 cm
−1 . Interestingly,
the spectrum is split into two bands when the peak wavelength of the vibrational mode
overlaps with the LSPR band. Notice that the spectral modulation was obtained only
by dropping the aqueous solution of L-sodium glutamate (20 mmol dm
−3 ) and airdried on the Au rod structured substrate. The spectral modulation might be obtained
by electromagnetic interaction between LSPR and the vibrational mode of the amino
acid derivative. It is speculated that the electromagnetic interaction results in the Rabi
splitting based on the strong coupling or the Fano dip around 23 cm
−1 based on the
weak coupling regime [7].
Ebbesen and his co-workers elucidated the vacuum Rabi splitting based on a
strong coupling between the molecular vibrational mode and the Fabry–Pérot microcavity mode [9]. The spectral properties of polyvinyl acetate (PVAc) employed in