

136
K. Ueno
molecular vibrational modes in the infrared wavelength range and the possibility of
modulating chemical reaction activities by the vibrational strong coupling [5, 6]. We
also study the spectrum modulation of LSPR band in the infrared wavelength region
in the presence of molecules [7]. In this chapter, we describe spectrum modulations
due to the interaction between infrared LSPR and molecular/intermolecular vibrational modes and demonstrate how to confirm the formation of hybrid states using
the strong coupling regime between LSPR and molecular excitonic states. Finally,
an application to a highly efficient photochemical reaction field using modal strong
coupling systems between plasmons and different optical modes is described.
8.2 Modulation of Infrared LSPR Bands by Interaction
with Molecular/Intermolecular Vibrational Modes
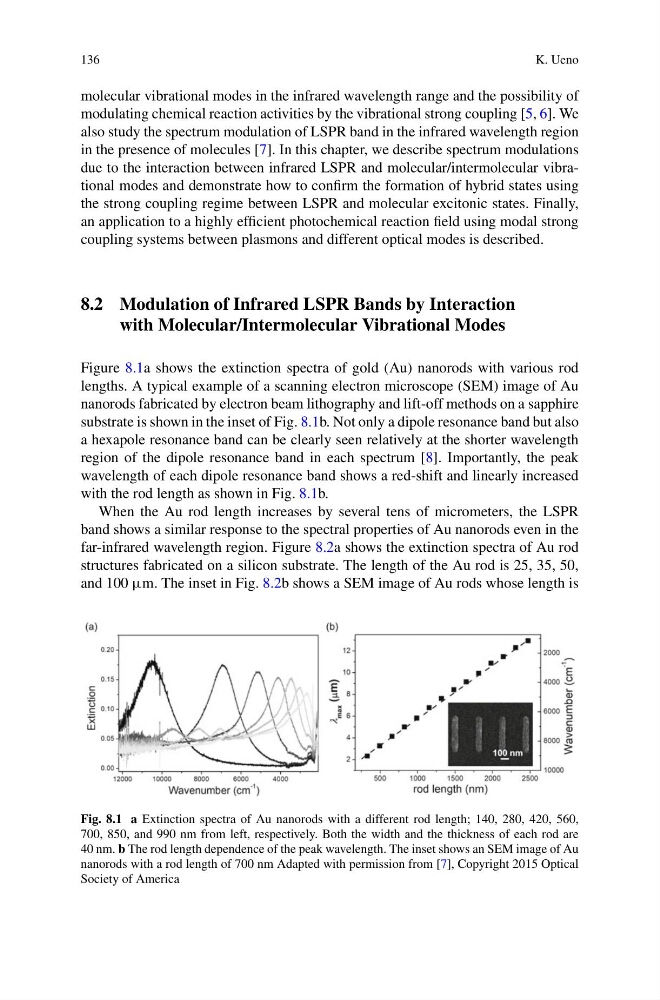
Figure 8.1a shows the extinction spectra of gold (Au) nanorods with various rod
lengths. A typical example of a scanning electron microscope (SEM) image of Au
nanorods fabricated by electron beam lithography and lift-off methods on a sapphire
substrate is shown in the inset of Fig. 8.1b. Not only a dipole resonance band but also
a hexapole resonance band can be clearly seen relatively at the shorter wavelength
region of the dipole resonance band in each spectrum [8]. Importantly, the peak
wavelength of each dipole resonance band shows a red-shift and linearly increased
with the rod length as shown in Fig. 8.1b.
When the Au rod length increases by several tens of micrometers, the LSPR
band shows a similar response to the spectral properties of Au nanorods even in the
far-infrared wavelength region. Figure 8.2a shows the extinction spectra of Au rod
structures fabricated on a silicon substrate. The length of the Au rod is 25, 35, 50,
and 100 µm. The inset in Fig. 8.2b shows a SEM image of Au rods whose length is
Fig. 8.1 a Extinction spectra of Au nanorods with a different rod length; 140, 280, 420, 560,
700, 850, and 990 nm from left, respectively. Both the width and the thickness of each rod are
40 nm. b The rod length dependence of the peak wavelength. The inset shows an SEM image of Au
nanorods with a rod length of 700 nm Adapted with permission from [7], Copyright 2015 Optical
Society of America
K. Ueno
molecular vibrational modes in the infrared wavelength range and the possibility of
modulating chemical reaction activities by the vibrational strong coupling [5, 6]. We
also study the spectrum modulation of LSPR band in the infrared wavelength region
in the presence of molecules [7]. In this chapter, we describe spectrum modulations
due to the interaction between infrared LSPR and molecular/intermolecular vibrational modes and demonstrate how to confirm the formation of hybrid states using
the strong coupling regime between LSPR and molecular excitonic states. Finally,
an application to a highly efficient photochemical reaction field using modal strong
coupling systems between plasmons and different optical modes is described.
8.2 Modulation of Infrared LSPR Bands by Interaction
with Molecular/Intermolecular Vibrational Modes
Figure 8.1a shows the extinction spectra of gold (Au) nanorods with various rod
lengths. A typical example of a scanning electron microscope (SEM) image of Au
nanorods fabricated by electron beam lithography and lift-off methods on a sapphire
substrate is shown in the inset of Fig. 8.1b. Not only a dipole resonance band but also
a hexapole resonance band can be clearly seen relatively at the shorter wavelength
region of the dipole resonance band in each spectrum [8]. Importantly, the peak
wavelength of each dipole resonance band shows a red-shift and linearly increased
with the rod length as shown in Fig. 8.1b.
When the Au rod length increases by several tens of micrometers, the LSPR
band shows a similar response to the spectral properties of Au nanorods even in the
far-infrared wavelength region. Figure 8.2a shows the extinction spectra of Au rod
structures fabricated on a silicon substrate. The length of the Au rod is 25, 35, 50,
and 100 µm. The inset in Fig. 8.2b shows a SEM image of Au rods whose length is
Fig. 8.1 a Extinction spectra of Au nanorods with a different rod length; 140, 280, 420, 560,
700, 850, and 990 nm from left, respectively. Both the width and the thickness of each rod are
40 nm. b The rod length dependence of the peak wavelength. The inset shows an SEM image of Au
nanorods with a rod length of 700 nm Adapted with permission from [7], Copyright 2015 Optical
Society of America