

7 Plasmon-Associated Control of Chemical Reaction at Nanometer …
119
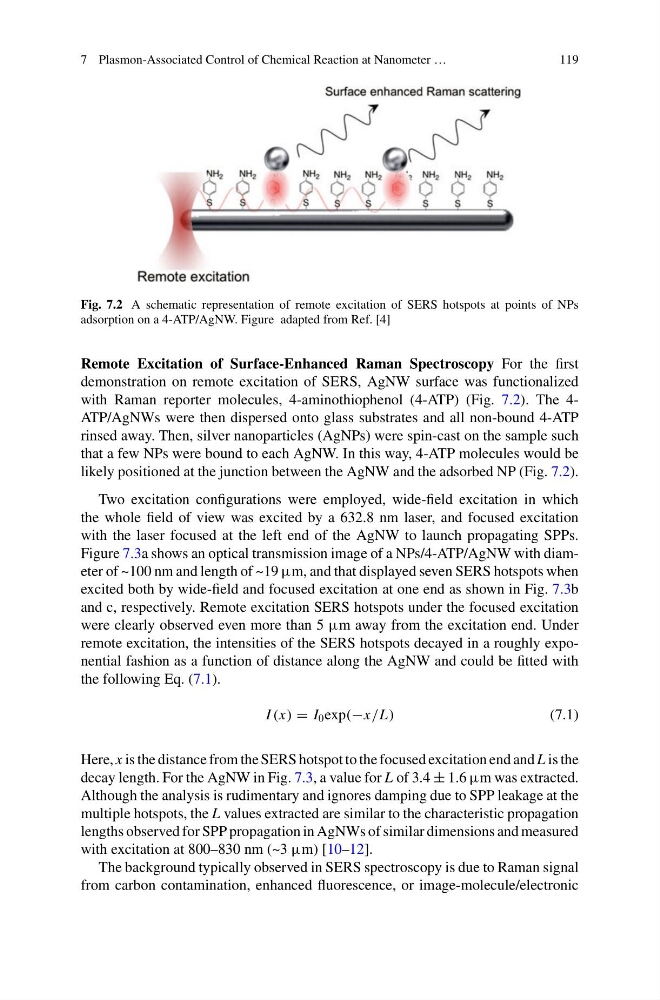
Fig. 7.2 A schematic representation of remote excitation of SERS hotspots at points of NPs
adsorption on a 4-ATP/AgNW. Figure adapted from Ref. [4]
Remote Excitation of Surface-Enhanced Raman Spectroscopy For the first
demonstration on remote excitation of SERS, AgNW surface was functionalized
with Raman reporter molecules, 4-aminothiophenol (4-ATP) (Fig. 7.2). The 4ATP/AgNWs were then dispersed onto glass substrates and all non-bound 4-ATP
rinsed away. Then, silver nanoparticles (AgNPs) were spin-cast on the sample such
that a few NPs were bound to each AgNW. In this way, 4-ATP molecules would be
likely positioned at the junction between the AgNW and the adsorbed NP (Fig. 7.2).
Two excitation configurations were employed, wide-field excitation in which
the whole field of view was excited by a 632.8 nm laser, and focused excitation
with the laser focused at the left end of the AgNW to launch propagating SPPs.
Figure 7.3a shows an optical transmission image of a NPs/4-ATP/AgNW with diameter of ~100 nm and length of ~19 µm, and that displayed seven SERS hotspots when
excited both by wide-field and focused excitation at one end as shown in Fig. 7.3b
and c, respectively. Remote excitation SERS hotspots under the focused excitation
were clearly observed even more than 5 µm away from the excitation end. Under
remote excitation, the intensities of the SERS hotspots decayed in a roughly exponential fashion as a function of distance along the AgNW and could be fitted with
the following Eq. (7.1).
I (x) = I 0 exp(−x/L)
(7.1)
Here, x is the distance from the SERS hotspot to the focused excitation end and L is the
decay length. For the AgNW in Fig. 7.3, a value for L of 3.4 ± 1.6 µm was extracted.
Although the analysis is rudimentary and ignores damping due to SPP leakage at the
multiple hotspots, the L values extracted are similar to the characteristic propagation
lengths observed for SPP propagation in AgNWs of similar dimensions and measured
with excitation at 800–830 nm (~3 µm) [10–12].
The background typically observed in SERS spectroscopy is due to Raman signal
from carbon contamination, enhanced fluorescence, or image-molecule/electronic
119
Fig. 7.2 A schematic representation of remote excitation of SERS hotspots at points of NPs
adsorption on a 4-ATP/AgNW. Figure adapted from Ref. [4]
Remote Excitation of Surface-Enhanced Raman Spectroscopy For the first
demonstration on remote excitation of SERS, AgNW surface was functionalized
with Raman reporter molecules, 4-aminothiophenol (4-ATP) (Fig. 7.2). The 4ATP/AgNWs were then dispersed onto glass substrates and all non-bound 4-ATP
rinsed away. Then, silver nanoparticles (AgNPs) were spin-cast on the sample such
that a few NPs were bound to each AgNW. In this way, 4-ATP molecules would be
likely positioned at the junction between the AgNW and the adsorbed NP (Fig. 7.2).
Two excitation configurations were employed, wide-field excitation in which
the whole field of view was excited by a 632.8 nm laser, and focused excitation
with the laser focused at the left end of the AgNW to launch propagating SPPs.
Figure 7.3a shows an optical transmission image of a NPs/4-ATP/AgNW with diameter of ~100 nm and length of ~19 µm, and that displayed seven SERS hotspots when
excited both by wide-field and focused excitation at one end as shown in Fig. 7.3b
and c, respectively. Remote excitation SERS hotspots under the focused excitation
were clearly observed even more than 5 µm away from the excitation end. Under
remote excitation, the intensities of the SERS hotspots decayed in a roughly exponential fashion as a function of distance along the AgNW and could be fitted with
the following Eq. (7.1).
I (x) = I 0 exp(−x/L)
(7.1)
Here, x is the distance from the SERS hotspot to the focused excitation end and L is the
decay length. For the AgNW in Fig. 7.3, a value for L of 3.4 ± 1.6 µm was extracted.
Although the analysis is rudimentary and ignores damping due to SPP leakage at the
multiple hotspots, the L values extracted are similar to the characteristic propagation
lengths observed for SPP propagation in AgNWs of similar dimensions and measured
with excitation at 800–830 nm (~3 µm) [10–12].
The background typically observed in SERS spectroscopy is due to Raman signal
from carbon contamination, enhanced fluorescence, or image-molecule/electronic