

106
K. Imaeda and K. Imura
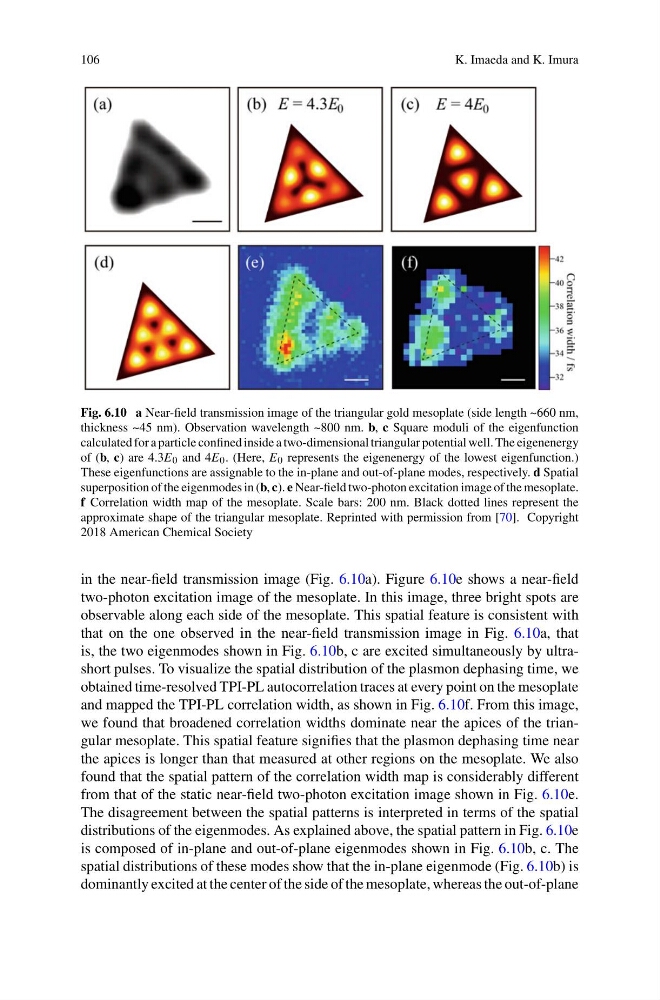
Fig. 6.10 a Near-field transmission image of the triangular gold mesoplate (side length ~660 nm,
thickness ~45 nm). Observation wavelength ~800 nm. b, c Square moduli of the eigenfunction
calculated for a particle confined inside a two-dimensional triangular potential well. The eigenenergy
of (b, c) are 4.3E 0 and 4E 0 . (Here, E 0 represents the eigenenergy of the lowest eigenfunction.)
These eigenfunctions are assignable to the in-plane and out-of-plane modes, respectively. d Spatial
superposition of the eigenmodes in (b, c). e Near-field two-photon excitation image of the mesoplate.
f Correlation width map of the mesoplate. Scale bars: 200 nm. Black dotted lines represent the
approximate shape of the triangular mesoplate. Reprinted with permission from [70]. Copyright
2018 American Chemical Society
in the near-field transmission image (Fig. 6.10a). Figure 6.10e shows a near-field
two-photon excitation image of the mesoplate. In this image, three bright spots are
observable along each side of the mesoplate. This spatial feature is consistent with
that on the one observed in the near-field transmission image in Fig. 6.10a, that
is, the two eigenmodes shown in Fig. 6.10b, c are excited simultaneously by ultrashort pulses. To visualize the spatial distribution of the plasmon dephasing time, we
obtained time-resolved TPI-PL autocorrelation traces at every point on the mesoplate
and mapped the TPI-PL correlation width, as shown in Fig. 6.10f. From this image,
we found that broadened correlation widths dominate near the apices of the triangular mesoplate. This spatial feature signifies that the plasmon dephasing time near
the apices is longer than that measured at other regions on the mesoplate. We also
found that the spatial pattern of the correlation width map is considerably different
from that of the static near-field two-photon excitation image shown in Fig. 6.10e.
The disagreement between the spatial patterns is interpreted in terms of the spatial
distributions of the eigenmodes. As explained above, the spatial pattern in Fig. 6.10e
is composed of in-plane and out-of-plane eigenmodes shown in Fig. 6.10b, c. The
spatial distributions of these modes show that the in-plane eigenmode (Fig. 6.10b) is
dominantly excited at the center of the side of the mesoplate, whereas the out-of-plane
K. Imaeda and K. Imura
Fig. 6.10 a Near-field transmission image of the triangular gold mesoplate (side length ~660 nm,
thickness ~45 nm). Observation wavelength ~800 nm. b, c Square moduli of the eigenfunction
calculated for a particle confined inside a two-dimensional triangular potential well. The eigenenergy
of (b, c) are 4.3E 0 and 4E 0 . (Here, E 0 represents the eigenenergy of the lowest eigenfunction.)
These eigenfunctions are assignable to the in-plane and out-of-plane modes, respectively. d Spatial
superposition of the eigenmodes in (b, c). e Near-field two-photon excitation image of the mesoplate.
f Correlation width map of the mesoplate. Scale bars: 200 nm. Black dotted lines represent the
approximate shape of the triangular mesoplate. Reprinted with permission from [70]. Copyright
2018 American Chemical Society
in the near-field transmission image (Fig. 6.10a). Figure 6.10e shows a near-field
two-photon excitation image of the mesoplate. In this image, three bright spots are
observable along each side of the mesoplate. This spatial feature is consistent with
that on the one observed in the near-field transmission image in Fig. 6.10a, that
is, the two eigenmodes shown in Fig. 6.10b, c are excited simultaneously by ultrashort pulses. To visualize the spatial distribution of the plasmon dephasing time, we
obtained time-resolved TPI-PL autocorrelation traces at every point on the mesoplate
and mapped the TPI-PL correlation width, as shown in Fig. 6.10f. From this image,
we found that broadened correlation widths dominate near the apices of the triangular mesoplate. This spatial feature signifies that the plasmon dephasing time near
the apices is longer than that measured at other regions on the mesoplate. We also
found that the spatial pattern of the correlation width map is considerably different
from that of the static near-field two-photon excitation image shown in Fig. 6.10e.
The disagreement between the spatial patterns is interpreted in terms of the spatial
distributions of the eigenmodes. As explained above, the spatial pattern in Fig. 6.10e
is composed of in-plane and out-of-plane eigenmodes shown in Fig. 6.10b, c. The
spatial distributions of these modes show that the in-plane eigenmode (Fig. 6.10b) is
dominantly excited at the center of the side of the mesoplate, whereas the out-of-plane