

6 Advanced Function Control of Photochemical Reactions …
105
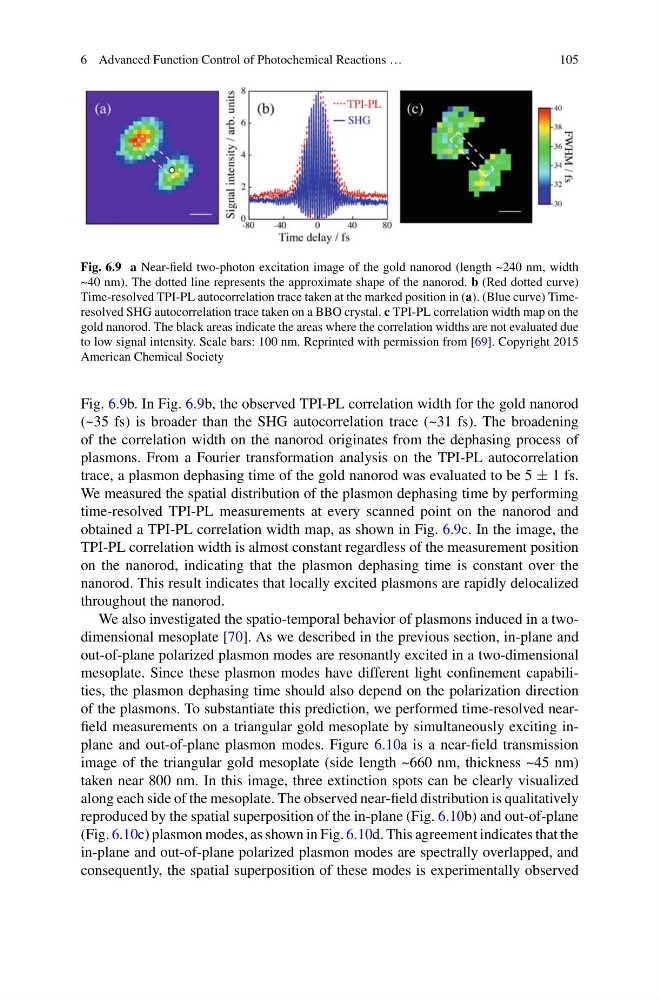
Fig. 6.9 a Near-field two-photon excitation image of the gold nanorod (length ~240 nm, width
~40 nm). The dotted line represents the approximate shape of the nanorod. b (Red dotted curve)
Time-resolved TPI-PL autocorrelation trace taken at the marked position in (a). (Blue curve) Timeresolved SHG autocorrelation trace taken on a BBO crystal. c TPI-PL correlation width map on the
gold nanorod. The black areas indicate the areas where the correlation widths are not evaluated due
to low signal intensity. Scale bars: 100 nm. Reprinted with permission from [69]. Copyright 2015
American Chemical Society
Fig. 6.9b. In Fig. 6.9b, the observed TPI-PL correlation width for the gold nanorod
(~35 fs) is broader than the SHG autocorrelation trace (~31 fs). The broadening
of the correlation width on the nanorod originates from the dephasing process of
plasmons. From a Fourier transformation analysis on the TPI-PL autocorrelation
trace, a plasmon dephasing time of the gold nanorod was evaluated to be 5 ± 1 fs.
We measured the spatial distribution of the plasmon dephasing time by performing
time-resolved TPI-PL measurements at every scanned point on the nanorod and
obtained a TPI-PL correlation width map, as shown in Fig. 6.9c. In the image, the
TPI-PL correlation width is almost constant regardless of the measurement position
on the nanorod, indicating that the plasmon dephasing time is constant over the
nanorod. This result indicates that locally excited plasmons are rapidly delocalized
throughout the nanorod.
We also investigated the spatio-temporal behavior of plasmons induced in a twodimensional mesoplate [70]. As we described in the previous section, in-plane and
out-of-plane polarized plasmon modes are resonantly excited in a two-dimensional
mesoplate. Since these plasmon modes have different light confinement capabilities, the plasmon dephasing time should also depend on the polarization direction
of the plasmons. To substantiate this prediction, we performed time-resolved nearfield measurements on a triangular gold mesoplate by simultaneously exciting inplane and out-of-plane plasmon modes. Figure 6.10a is a near-field transmission
image of the triangular gold mesoplate (side length ~660 nm, thickness ~45 nm)
taken near 800 nm. In this image, three extinction spots can be clearly visualized
along each side of the mesoplate. The observed near-field distribution is qualitatively
reproduced by the spatial superposition of the in-plane (Fig. 6.10b) and out-of-plane
(Fig. 6.10c) plasmon modes, as shown in Fig. 6.10d. This agreement indicates that the
in-plane and out-of-plane polarized plasmon modes are spectrally overlapped, and
consequently, the spatial superposition of these modes is experimentally observed
105
Fig. 6.9 a Near-field two-photon excitation image of the gold nanorod (length ~240 nm, width
~40 nm). The dotted line represents the approximate shape of the nanorod. b (Red dotted curve)
Time-resolved TPI-PL autocorrelation trace taken at the marked position in (a). (Blue curve) Timeresolved SHG autocorrelation trace taken on a BBO crystal. c TPI-PL correlation width map on the
gold nanorod. The black areas indicate the areas where the correlation widths are not evaluated due
to low signal intensity. Scale bars: 100 nm. Reprinted with permission from [69]. Copyright 2015
American Chemical Society
Fig. 6.9b. In Fig. 6.9b, the observed TPI-PL correlation width for the gold nanorod
(~35 fs) is broader than the SHG autocorrelation trace (~31 fs). The broadening
of the correlation width on the nanorod originates from the dephasing process of
plasmons. From a Fourier transformation analysis on the TPI-PL autocorrelation
trace, a plasmon dephasing time of the gold nanorod was evaluated to be 5 ± 1 fs.
We measured the spatial distribution of the plasmon dephasing time by performing
time-resolved TPI-PL measurements at every scanned point on the nanorod and
obtained a TPI-PL correlation width map, as shown in Fig. 6.9c. In the image, the
TPI-PL correlation width is almost constant regardless of the measurement position
on the nanorod, indicating that the plasmon dephasing time is constant over the
nanorod. This result indicates that locally excited plasmons are rapidly delocalized
throughout the nanorod.
We also investigated the spatio-temporal behavior of plasmons induced in a twodimensional mesoplate [70]. As we described in the previous section, in-plane and
out-of-plane polarized plasmon modes are resonantly excited in a two-dimensional
mesoplate. Since these plasmon modes have different light confinement capabilities, the plasmon dephasing time should also depend on the polarization direction
of the plasmons. To substantiate this prediction, we performed time-resolved nearfield measurements on a triangular gold mesoplate by simultaneously exciting inplane and out-of-plane plasmon modes. Figure 6.10a is a near-field transmission
image of the triangular gold mesoplate (side length ~660 nm, thickness ~45 nm)
taken near 800 nm. In this image, three extinction spots can be clearly visualized
along each side of the mesoplate. The observed near-field distribution is qualitatively
reproduced by the spatial superposition of the in-plane (Fig. 6.10b) and out-of-plane
(Fig. 6.10c) plasmon modes, as shown in Fig. 6.10d. This agreement indicates that the
in-plane and out-of-plane polarized plasmon modes are spectrally overlapped, and
consequently, the spatial superposition of these modes is experimentally observed