

6 Advanced Function Control of Photochemical Reactions …
107
mode (Fig. 6.10c) is dominantly excited at the apices of the mesoplate. Considering
this position-dependent excitation probability of the eigenmodes, the spatial pattern
in Fig. 6.10f can be considered to be similar to the spatial distribution of the outof-plane mode (Fig. 6.10c). This result indicates that the out-of-plane mode has a
longer dephasing time than the in-plane mode. Since the plasmon dephasing time is
significantly related to the temporal confinement of light, our finding suggests that
the out-of-plane plasmon mode is more strongly enhanced in the near-field optical
region.
6.5 Enhancement of Optical Responses of Molecules
by Mesoscopic Structures
To elucidate the interaction between locally enhanced fields on metal mesostructures
and molecular systems, we explored plasmon-enhanced photochemical reactions on
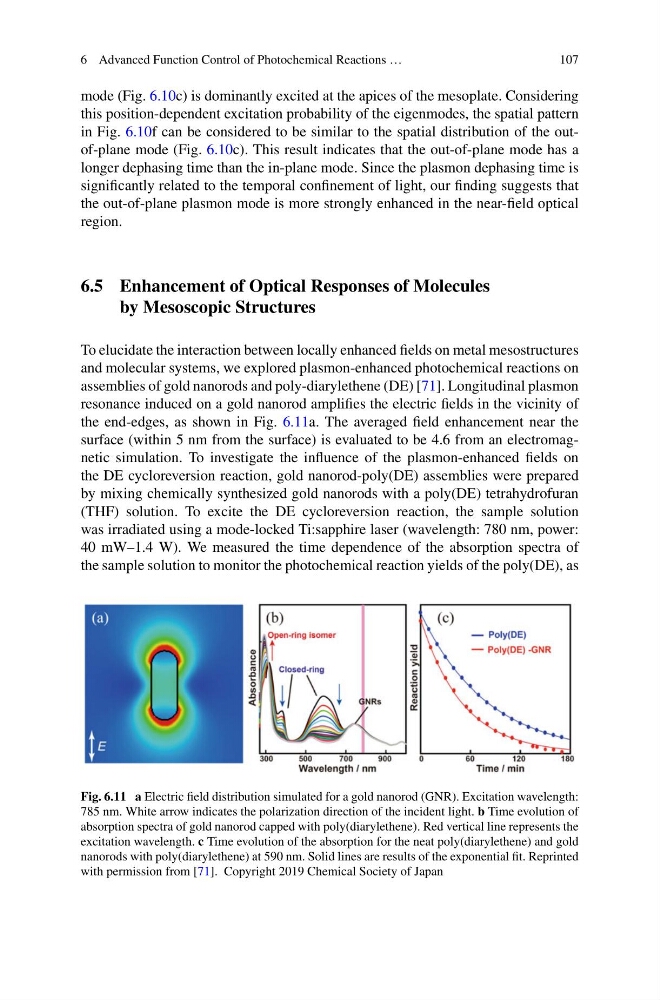
assemblies of gold nanorods and poly-diarylethene (DE) [71]. Longitudinal plasmon
resonance induced on a gold nanorod amplifies the electric fields in the vicinity of
the end-edges, as shown in Fig. 6.11a. The averaged field enhancement near the
surface (within 5 nm from the surface) is evaluated to be 4.6 from an electromagnetic simulation. To investigate the influence of the plasmon-enhanced fields on
the DE cycloreversion reaction, gold nanorod-poly(DE) assemblies were prepared
by mixing chemically synthesized gold nanorods with a poly(DE) tetrahydrofuran
(THF) solution. To excite the DE cycloreversion reaction, the sample solution
was irradiated using a mode-locked Ti:sapphire laser (wavelength: 780 nm, power:
40 mW–1.4 W). We measured the time dependence of the absorption spectra of
the sample solution to monitor the photochemical reaction yields of the poly(DE), as
Fig. 6.11 a Electric field distribution simulated for a gold nanorod (GNR). Excitation wavelength:
785 nm. White arrow indicates the polarization direction of the incident light. b Time evolution of
absorption spectra of gold nanorod capped with poly(diarylethene). Red vertical line represents the
excitation wavelength. c Time evolution of the absorption for the neat poly(diarylethene) and gold
nanorods with poly(diarylethene) at 590 nm. Solid lines are results of the exponential fit. Reprinted
with permission from [71]. Copyright 2019 Chemical Society of Japan
107
mode (Fig. 6.10c) is dominantly excited at the apices of the mesoplate. Considering
this position-dependent excitation probability of the eigenmodes, the spatial pattern
in Fig. 6.10f can be considered to be similar to the spatial distribution of the outof-plane mode (Fig. 6.10c). This result indicates that the out-of-plane mode has a
longer dephasing time than the in-plane mode. Since the plasmon dephasing time is
significantly related to the temporal confinement of light, our finding suggests that
the out-of-plane plasmon mode is more strongly enhanced in the near-field optical
region.
6.5 Enhancement of Optical Responses of Molecules
by Mesoscopic Structures
To elucidate the interaction between locally enhanced fields on metal mesostructures
and molecular systems, we explored plasmon-enhanced photochemical reactions on
assemblies of gold nanorods and poly-diarylethene (DE) [71]. Longitudinal plasmon
resonance induced on a gold nanorod amplifies the electric fields in the vicinity of
the end-edges, as shown in Fig. 6.11a. The averaged field enhancement near the
surface (within 5 nm from the surface) is evaluated to be 4.6 from an electromagnetic simulation. To investigate the influence of the plasmon-enhanced fields on
the DE cycloreversion reaction, gold nanorod-poly(DE) assemblies were prepared
by mixing chemically synthesized gold nanorods with a poly(DE) tetrahydrofuran
(THF) solution. To excite the DE cycloreversion reaction, the sample solution
was irradiated using a mode-locked Ti:sapphire laser (wavelength: 780 nm, power:
40 mW–1.4 W). We measured the time dependence of the absorption spectra of
the sample solution to monitor the photochemical reaction yields of the poly(DE), as
Fig. 6.11 a Electric field distribution simulated for a gold nanorod (GNR). Excitation wavelength:
785 nm. White arrow indicates the polarization direction of the incident light. b Time evolution of
absorption spectra of gold nanorod capped with poly(diarylethene). Red vertical line represents the
excitation wavelength. c Time evolution of the absorption for the neat poly(diarylethene) and gold
nanorods with poly(diarylethene) at 590 nm. Solid lines are results of the exponential fit. Reprinted
with permission from [71]. Copyright 2019 Chemical Society of Japan