

solubility (kg/kg)
temperature (°C)
n = 8
n = 10
n = 12
n = 14
n = 16
n = 18
75
4 × 10 −3
7 × 10 −4
10 −4
1.5 × 10 −5
–
–
100
9 × 10 −3
10 −3
1.8 × 10 −4
5 × 10 −5
–
–
150
4 × 10 −2
7 × 10 −2
10 −3
4 × 10 −4
9 × 10 −6
–
200
1.5 × 10 −1
2 × 10 −2
10 −2
1.5 × 10 −3
8 × 10 −4
5 × 10 −5
10 −1 a
225
1.2
5 × 10 −2
5 × 10 −3
5 × 10 −3
6 × 10 −4
Increase b
3000
142.8 a
500
333.3
–
–
Source: Peterson, A., Vogel, F., Lachance, R., Frolling, M., Antal, M., and Tester, J., Energy &
Environmental Science, 1, 32–65, 2008. With permission.
a The best extrapolated estimates from the graphical data.
b Increase numbers denote the ratio of fatty acid concentration at 225°C/fatty acid concentration at 75°C.
n, number of carbon atoms in fatty acid.
116
Water for Energy and Fuel Production
While the dissociation constant goes through a maximum with changes in temperature,
it is also changed by about 5 orders of magnitude in nearly the same temperature range.
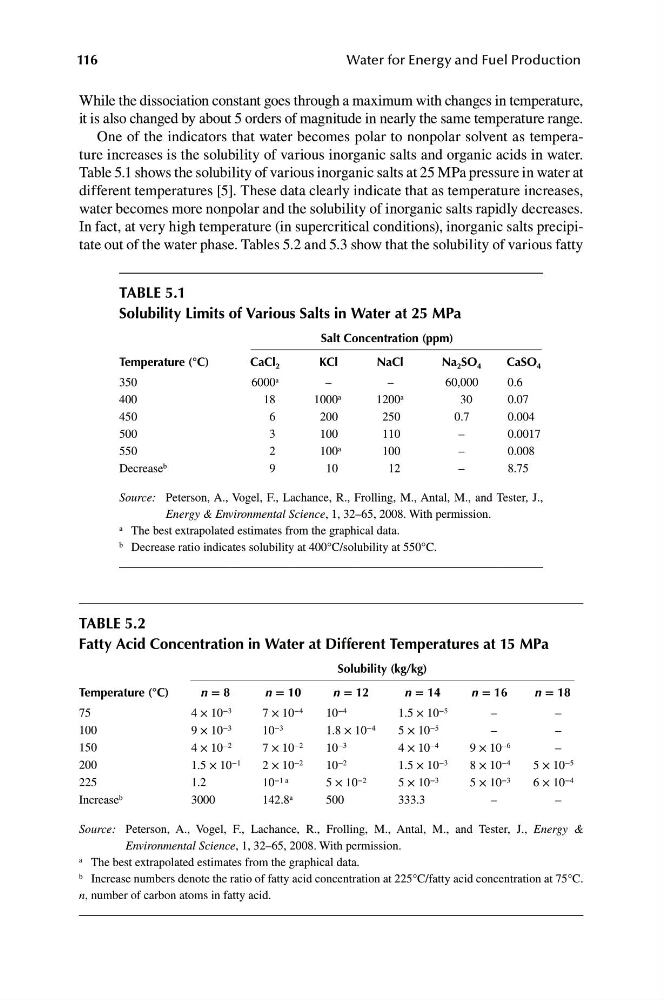
One of the indicators that water becomes polar to nonpolar solvent as temperature increases is the solubility of various inorganic salts and organic acids in water.
Table 5.1 shows the solubility of various inorganic salts at 25 MPa pressure in water at
different temperatures [5]. These data clearly indicate that as temperature increases,
water becomes more nonpolar and the solubility of inorganic salts rapidly decreases.
In fact, at very high temperature (in supercritical conditions), inorganic salts precipitate out of the water phase. Tables 5.2 and 5.3 show that the solubility of various fatty
taBle 5.1
solubility limits of Various salts in Water at 25 mPa
salt Concentration (ppm)
temperature (°C)
CaCl 2
KCl
naCl
na 2 sO 4
CasO 4
350
6000 a
–
–
60,000
0.6
400
18
1000 a
1200 a
30
0.07
450
6
200
250
0.7
0.004
500
3
100
110
–
0.0017
550
2
100 a
100
–
0.008
Decrease b
9
10
12
–
8.75
Source: Peterson, A., Vogel, F., Lachance, R., Frolling, M., Antal, M., and Tester, J.,
Energy & Environmental Science, 1, 32–65, 2008. With permission.
a The best extrapolated estimates from the graphical data.
b Decrease ratio indicates solubility at 400°C/solubility at 550°C.
taBle 5.2
Fatty acid Concentration in Water at different temperatures at 15 mPa
temperature (°C)
n = 8
n = 10
n = 12
n = 14
n = 16
n = 18
75
4 × 10 −3
7 × 10 −4
10 −4
1.5 × 10 −5
–
–
100
9 × 10 −3
10 −3
1.8 × 10 −4
5 × 10 −5
–
–
150
4 × 10 −2
7 × 10 −2
10 −3
4 × 10 −4
9 × 10 −6
–
200
1.5 × 10 −1
2 × 10 −2
10 −2
1.5 × 10 −3
8 × 10 −4
5 × 10 −5
10 −1 a
225
1.2
5 × 10 −2
5 × 10 −3
5 × 10 −3
6 × 10 −4
Increase b
3000
142.8 a
500
333.3
–
–
Source: Peterson, A., Vogel, F., Lachance, R., Frolling, M., Antal, M., and Tester, J., Energy &
Environmental Science, 1, 32–65, 2008. With permission.
a The best extrapolated estimates from the graphical data.
b Increase numbers denote the ratio of fatty acid concentration at 225°C/fatty acid concentration at 75°C.
n, number of carbon atoms in fatty acid.
116
Water for Energy and Fuel Production
While the dissociation constant goes through a maximum with changes in temperature,
it is also changed by about 5 orders of magnitude in nearly the same temperature range.
One of the indicators that water becomes polar to nonpolar solvent as temperature increases is the solubility of various inorganic salts and organic acids in water.
Table 5.1 shows the solubility of various inorganic salts at 25 MPa pressure in water at
different temperatures [5]. These data clearly indicate that as temperature increases,
water becomes more nonpolar and the solubility of inorganic salts rapidly decreases.
In fact, at very high temperature (in supercritical conditions), inorganic salts precipitate out of the water phase. Tables 5.2 and 5.3 show that the solubility of various fatty
taBle 5.1
solubility limits of Various salts in Water at 25 mPa
salt Concentration (ppm)
temperature (°C)
CaCl 2
KCl
naCl
na 2 sO 4
CasO 4
350
6000 a
–
–
60,000
0.6
400
18
1000 a
1200 a
30
0.07
450
6
200
250
0.7
0.004
500
3
100
110
–
0.0017
550
2
100 a
100
–
0.008
Decrease b
9
10
12
–
8.75
Source: Peterson, A., Vogel, F., Lachance, R., Frolling, M., Antal, M., and Tester, J.,
Energy & Environmental Science, 1, 32–65, 2008. With permission.
a The best extrapolated estimates from the graphical data.
b Decrease ratio indicates solubility at 400°C/solubility at 550°C.
taBle 5.2
Fatty acid Concentration in Water at different temperatures at 15 mPa