

4.2 Temperature Drop in the Aluminium Head Form Without a Helmet
91
Temp. in Deg. C.
(Mean-Ambient) 0 kph
(Mean-Ambient) 15 kph
25.0
(Mean-Ambient) 35 kph
(Mean-Ambient) 55 kph
20.0
(Mean-Ambient) 75 kph
15.0
10.0
5.0
0.0
0:00:00
0:07:12
0:14:24
0:21:36
0:28:48
0:36:00
0:43:12
0:50:24
0:57:36
1:04:48
Time:h:mm:ss
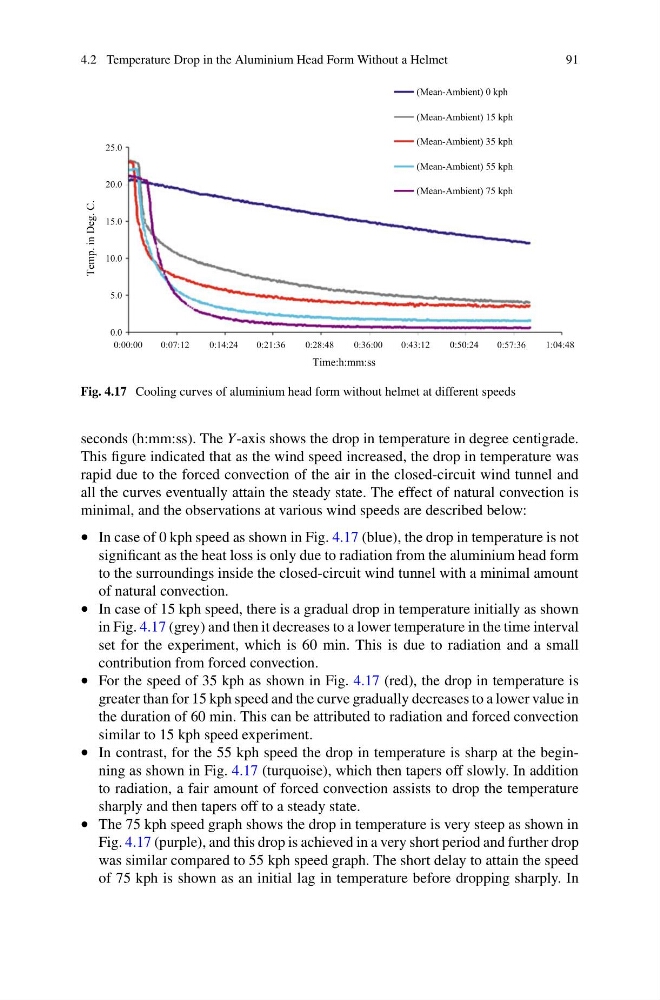
Fig. 4.17 Cooling curves of aluminium head form without helmet at different speeds
seconds (h:mm:ss). The Y-axis shows the drop in temperature in degree centigrade.
This figure indicated that as the wind speed increased, the drop in temperature was
rapid due to the forced convection of the air in the closed-circuit wind tunnel and
all the curves eventually attain the steady state. The effect of natural convection is
minimal, and the observations at various wind speeds are described below:
• In case of 0 kph speed as shown in Fig. 4.17 (blue), the drop in temperature is not
significant as the heat loss is only due to radiation from the aluminium head form
to the surroundings inside the closed-circuit wind tunnel with a minimal amount
of natural convection.
• In case of 15 kph speed, there is a gradual drop in temperature initially as shown
in Fig. 4.17 (grey) and then it decreases to a lower temperature in the time interval
set for the experiment, which is 60 min. This is due to radiation and a small
contribution from forced convection.
• For the speed of 35 kph as shown in Fig. 4.17 (red), the drop in temperature is
greater than for 15 kph speed and the curve gradually decreases to a lower value in
the duration of 60 min. This can be attributed to radiation and forced convection
similar to 15 kph speed experiment.
• In contrast, for the 55 kph speed the drop in temperature is sharp at the beginning as shown in Fig. 4.17 (turquoise), which then tapers off slowly. In addition
to radiation, a fair amount of forced convection assists to drop the temperature
sharply and then tapers off to a steady state.
• The 75 kph speed graph shows the drop in temperature is very steep as shown in
Fig. 4.17 (purple), and this drop is achieved in a very short period and further drop
was similar compared to 55 kph speed graph. The short delay to attain the speed
of 75 kph is shown as an initial lag in temperature before dropping sharply. In
91
Temp. in Deg. C.
(Mean-Ambient) 0 kph
(Mean-Ambient) 15 kph
25.0
(Mean-Ambient) 35 kph
(Mean-Ambient) 55 kph
20.0
(Mean-Ambient) 75 kph
15.0
10.0
5.0
0.0
0:00:00
0:07:12
0:14:24
0:21:36
0:28:48
0:36:00
0:43:12
0:50:24
0:57:36
1:04:48
Time:h:mm:ss
Fig. 4.17 Cooling curves of aluminium head form without helmet at different speeds
seconds (h:mm:ss). The Y-axis shows the drop in temperature in degree centigrade.
This figure indicated that as the wind speed increased, the drop in temperature was
rapid due to the forced convection of the air in the closed-circuit wind tunnel and
all the curves eventually attain the steady state. The effect of natural convection is
minimal, and the observations at various wind speeds are described below:
• In case of 0 kph speed as shown in Fig. 4.17 (blue), the drop in temperature is not
significant as the heat loss is only due to radiation from the aluminium head form
to the surroundings inside the closed-circuit wind tunnel with a minimal amount
of natural convection.
• In case of 15 kph speed, there is a gradual drop in temperature initially as shown
in Fig. 4.17 (grey) and then it decreases to a lower temperature in the time interval
set for the experiment, which is 60 min. This is due to radiation and a small
contribution from forced convection.
• For the speed of 35 kph as shown in Fig. 4.17 (red), the drop in temperature is
greater than for 15 kph speed and the curve gradually decreases to a lower value in
the duration of 60 min. This can be attributed to radiation and forced convection
similar to 15 kph speed experiment.
• In contrast, for the 55 kph speed the drop in temperature is sharp at the beginning as shown in Fig. 4.17 (turquoise), which then tapers off slowly. In addition
to radiation, a fair amount of forced convection assists to drop the temperature
sharply and then tapers off to a steady state.
• The 75 kph speed graph shows the drop in temperature is very steep as shown in
Fig. 4.17 (purple), and this drop is achieved in a very short period and further drop
was similar compared to 55 kph speed graph. The short delay to attain the speed
of 75 kph is shown as an initial lag in temperature before dropping sharply. In