

90
4 Results and Discussion
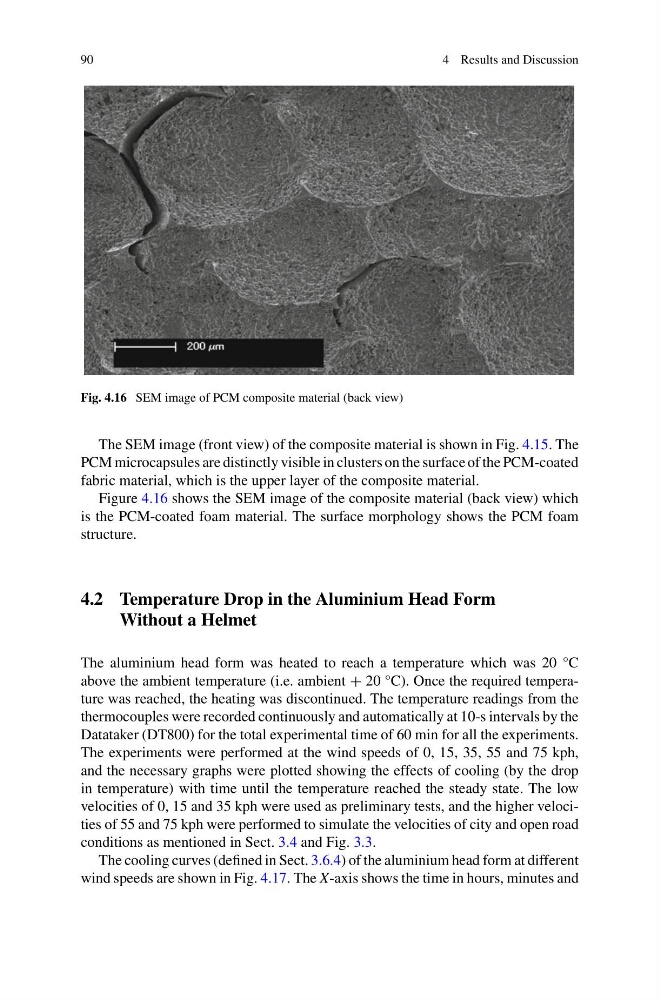
Fig. 4.16 SEM image of PCM composite material (back view)
The SEM image (front view) of the composite material is shown in Fig. 4.15. The
PCM microcapsules are distinctly visible in clusters on the surface of the PCM-coated
fabric material, which is the upper layer of the composite material.
Figure 4.16 shows the SEM image of the composite material (back view) which
is the PCM-coated foam material. The surface morphology shows the PCM foam
structure.
4.2 Temperature Drop in the Aluminium Head Form
Without a Helmet
The aluminium head form was heated to reach a temperature which was 20 °C
above the ambient temperature (i.e. ambient + 20 °C). Once the required temperature was reached, the heating was discontinued. The temperature readings from the
thermocouples were recorded continuously and automatically at 10-s intervals by the
Datataker (DT800) for the total experimental time of 60 min for all the experiments.
The experiments were performed at the wind speeds of 0, 15, 35, 55 and 75 kph,
and the necessary graphs were plotted showing the effects of cooling (by the drop
in temperature) with time until the temperature reached the steady state. The low
velocities of 0, 15 and 35 kph were used as preliminary tests, and the higher velocities of 55 and 75 kph were performed to simulate the velocities of city and open road
conditions as mentioned in Sect. 3.4 and Fig. 3.3.
The cooling curves (defined in Sect. 3.6.4) of the aluminium head form at different
wind speeds are shown in Fig. 4.17. The X-axis shows the time in hours, minutes and
4 Results and Discussion
Fig. 4.16 SEM image of PCM composite material (back view)
The SEM image (front view) of the composite material is shown in Fig. 4.15. The
PCM microcapsules are distinctly visible in clusters on the surface of the PCM-coated
fabric material, which is the upper layer of the composite material.
Figure 4.16 shows the SEM image of the composite material (back view) which
is the PCM-coated foam material. The surface morphology shows the PCM foam
structure.
4.2 Temperature Drop in the Aluminium Head Form
Without a Helmet
The aluminium head form was heated to reach a temperature which was 20 °C
above the ambient temperature (i.e. ambient + 20 °C). Once the required temperature was reached, the heating was discontinued. The temperature readings from the
thermocouples were recorded continuously and automatically at 10-s intervals by the
Datataker (DT800) for the total experimental time of 60 min for all the experiments.
The experiments were performed at the wind speeds of 0, 15, 35, 55 and 75 kph,
and the necessary graphs were plotted showing the effects of cooling (by the drop
in temperature) with time until the temperature reached the steady state. The low
velocities of 0, 15 and 35 kph were used as preliminary tests, and the higher velocities of 55 and 75 kph were performed to simulate the velocities of city and open road
conditions as mentioned in Sect. 3.4 and Fig. 3.3.
The cooling curves (defined in Sect. 3.6.4) of the aluminium head form at different
wind speeds are shown in Fig. 4.17. The X-axis shows the time in hours, minutes and