

92
4 Results and Discussion
this case compared to the radiation, the forced convection plays a dominant role
in decreasing the temperature very steeply and then gradually reaches the steady
state.
4.3 Temperature Drop Using PWAT Material
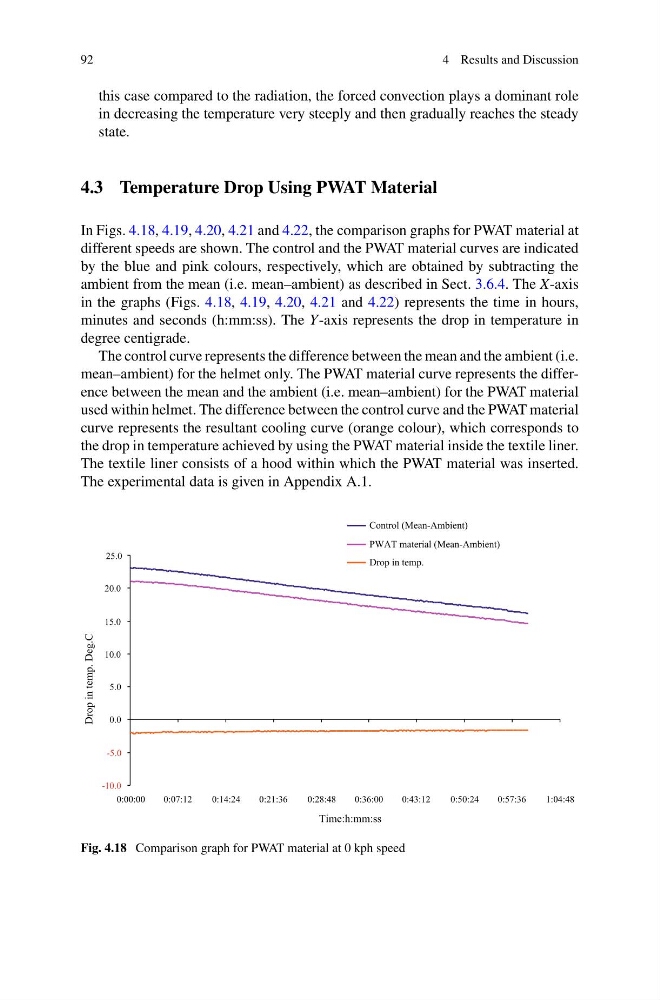
In Figs. 4.18, 4.19, 4.20, 4.21 and 4.22, the comparison graphs for PWAT material at
different speeds are shown. The control and the PWAT material curves are indicated
by the blue and pink colours, respectively, which are obtained by subtracting the
ambient from the mean (i.e. mean–ambient) as described in Sect. 3.6.4. The X-axis
in the graphs (Figs. 4.18, 4.19, 4.20, 4.21 and 4.22) represents the time in hours,
minutes and seconds (h:mm:ss). The Y-axis represents the drop in temperature in
degree centigrade.
The control curve represents the difference between the mean and the ambient (i.e.
mean–ambient) for the helmet only. The PWAT material curve represents the difference between the mean and the ambient (i.e. mean–ambient) for the PWAT material
used within helmet. The difference between the control curve and the PWAT material
curve represents the resultant cooling curve (orange colour), which corresponds to
the drop in temperature achieved by using the PWAT material inside the textile liner.
The textile liner consists of a hood within which the PWAT material was inserted.
The experimental data is given in Appendix A.1.
Drop in temp. Deg.C
Control (Mean-Ambient)
25.0
PWAT material (Mean-Ambient)
Drop in temp.
20.0
15.0
10.0
5.0
0.0
-5.0
-10.0
0:00:00
0:07:12
0:14:24
0:21:36
0:28:48
0:36:00
0:43:12
0:50:24
0:57:36
1:04:48
Time:h:mm:ss
Fig. 4.18 Comparison graph for PWAT material at 0 kph speed
4 Results and Discussion
this case compared to the radiation, the forced convection plays a dominant role
in decreasing the temperature very steeply and then gradually reaches the steady
state.
4.3 Temperature Drop Using PWAT Material
In Figs. 4.18, 4.19, 4.20, 4.21 and 4.22, the comparison graphs for PWAT material at
different speeds are shown. The control and the PWAT material curves are indicated
by the blue and pink colours, respectively, which are obtained by subtracting the
ambient from the mean (i.e. mean–ambient) as described in Sect. 3.6.4. The X-axis
in the graphs (Figs. 4.18, 4.19, 4.20, 4.21 and 4.22) represents the time in hours,
minutes and seconds (h:mm:ss). The Y-axis represents the drop in temperature in
degree centigrade.
The control curve represents the difference between the mean and the ambient (i.e.
mean–ambient) for the helmet only. The PWAT material curve represents the difference between the mean and the ambient (i.e. mean–ambient) for the PWAT material
used within helmet. The difference between the control curve and the PWAT material
curve represents the resultant cooling curve (orange colour), which corresponds to
the drop in temperature achieved by using the PWAT material inside the textile liner.
The textile liner consists of a hood within which the PWAT material was inserted.
The experimental data is given in Appendix A.1.
Drop in temp. Deg.C
Control (Mean-Ambient)
25.0
PWAT material (Mean-Ambient)
Drop in temp.
20.0
15.0
10.0
5.0
0.0
-5.0
-10.0
0:00:00
0:07:12
0:14:24
0:21:36
0:28:48
0:36:00
0:43:12
0:50:24
0:57:36
1:04:48
Time:h:mm:ss
Fig. 4.18 Comparison graph for PWAT material at 0 kph speed