

112
4 Results and Discussion
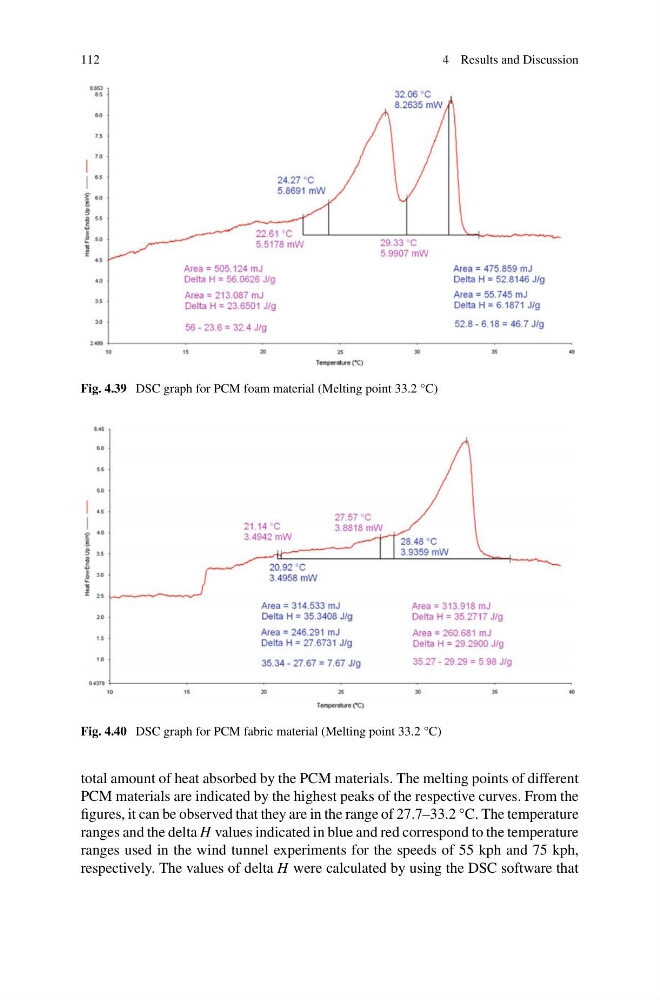
Fig. 4.39 DSC graph for PCM foam material (Melting point 33.2 °C)
Fig. 4.40 DSC graph for PCM fabric material (Melting point 33.2 °C)
total amount of heat absorbed by the PCM materials. The melting points of different
PCM materials are indicated by the highest peaks of the respective curves. From the
figures, it can be observed that they are in the range of 27.7–33.2 °C. The temperature
ranges and the delta H values indicated in blue and red correspond to the temperature
ranges used in the wind tunnel experiments for the speeds of 55 kph and 75 kph,
respectively. The values of delta H were calculated by using the DSC software that
4 Results and Discussion
Fig. 4.39 DSC graph for PCM foam material (Melting point 33.2 °C)
Fig. 4.40 DSC graph for PCM fabric material (Melting point 33.2 °C)
total amount of heat absorbed by the PCM materials. The melting points of different
PCM materials are indicated by the highest peaks of the respective curves. From the
figures, it can be observed that they are in the range of 27.7–33.2 °C. The temperature
ranges and the delta H values indicated in blue and red correspond to the temperature
ranges used in the wind tunnel experiments for the speeds of 55 kph and 75 kph,
respectively. The values of delta H were calculated by using the DSC software that