

110
4 Results and Discussion
Table 4.4 Drop in temperature achieved by various PCM materials at 75 kph speed
Materials
Corresponding
time of MDIT*
(h:mm:ss)
Control ‘A’
(Mean–Ambient)
(°C)
Material ‘B’
(Mean–Ambient)
(°C)
MDIT * (B-A)
(°C)
PCM Non-woven 0:30:00
5.09
2.0
– 3.1
PCM Foam
0:25:10
5.58
1.87
– 3.7
PCM Fabric
0:23:20
5.82
2.07
– 3.8
PCM Composite
0:24:40
5.64
1.94
– 3.7
* Maximum drop in temperature
and 75 kph speeds. This was attributed to the higher speeds of 55 and 75 kph in the
wind tunnel.
It was observed from Fig. 4.36 that the effective cooling achieved is highest
with PCM fabric material and lowest with PCM non-woven material. The drop in
temperature varied from 3.1 °C to a maximum of 3.8 °C depending on the type of
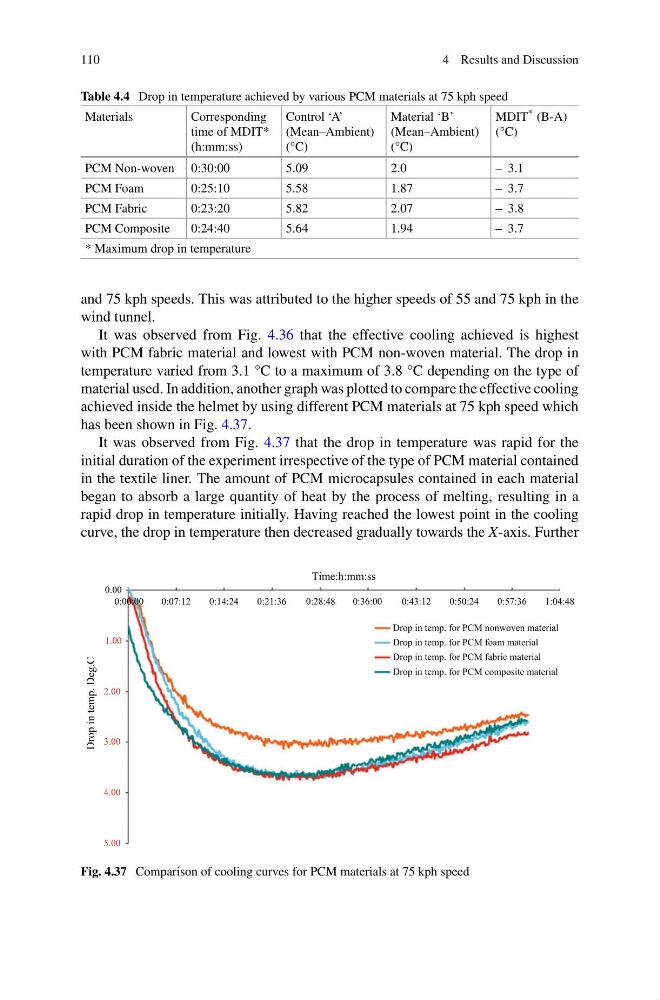
material used. In addition, another graph was plotted to compare the effective cooling
achieved inside the helmet by using different PCM materials at 75 kph speed which
has been shown in Fig. 4.37.
It was observed from Fig. 4.37 that the drop in temperature was rapid for the
initial duration of the experiment irrespective of the type of PCM material contained
in the textile liner. The amount of PCM microcapsules contained in each material
began to absorb a large quantity of heat by the process of melting, resulting in a
rapid drop in temperature initially. Having reached the lowest point in the cooling
curve, the drop in temperature then decreased gradually towards the X-axis. Further
Drop in temp. Deg.C
0.00
Time:h:mm:ss
0:00:00
0:07:12
0:14:24
0:21:36
0:28:48
0:36:00
0:43:12
0:50:24
0:57:36
1:04:48
1.00
Drop in temp. for PCM nonwoven material
Drop in temp. for PCM foam material
Drop in temp. for PCM fabric material
Drop in temp. for PCM composite material
2.00
3.00
4.00
5.00
Fig. 4.37 Comparison of cooling curves for PCM materials at 75 kph speed
4 Results and Discussion
Table 4.4 Drop in temperature achieved by various PCM materials at 75 kph speed
Materials
Corresponding
time of MDIT*
(h:mm:ss)
Control ‘A’
(Mean–Ambient)
(°C)
Material ‘B’
(Mean–Ambient)
(°C)
MDIT * (B-A)
(°C)
PCM Non-woven 0:30:00
5.09
2.0
– 3.1
PCM Foam
0:25:10
5.58
1.87
– 3.7
PCM Fabric
0:23:20
5.82
2.07
– 3.8
PCM Composite
0:24:40
5.64
1.94
– 3.7
* Maximum drop in temperature
and 75 kph speeds. This was attributed to the higher speeds of 55 and 75 kph in the
wind tunnel.
It was observed from Fig. 4.36 that the effective cooling achieved is highest
with PCM fabric material and lowest with PCM non-woven material. The drop in
temperature varied from 3.1 °C to a maximum of 3.8 °C depending on the type of
material used. In addition, another graph was plotted to compare the effective cooling
achieved inside the helmet by using different PCM materials at 75 kph speed which
has been shown in Fig. 4.37.
It was observed from Fig. 4.37 that the drop in temperature was rapid for the
initial duration of the experiment irrespective of the type of PCM material contained
in the textile liner. The amount of PCM microcapsules contained in each material
began to absorb a large quantity of heat by the process of melting, resulting in a
rapid drop in temperature initially. Having reached the lowest point in the cooling
curve, the drop in temperature then decreased gradually towards the X-axis. Further
Drop in temp. Deg.C
0.00
Time:h:mm:ss
0:00:00
0:07:12
0:14:24
0:21:36
0:28:48
0:36:00
0:43:12
0:50:24
0:57:36
1:04:48
1.00
Drop in temp. for PCM nonwoven material
Drop in temp. for PCM foam material
Drop in temp. for PCM fabric material
Drop in temp. for PCM composite material
2.00
3.00
4.00
5.00
Fig. 4.37 Comparison of cooling curves for PCM materials at 75 kph speed