

4.5 Temperature Drop with PCM Materials
109
Drop in temp. Deg.C
Control (Mean-Ambient)
12.0
PCM composite material (Mean-Ambient)
Drop in temp.
10.0
8.0
6.0
4.0
2.0
0.0
0:00:00
0:07:12
0:14:24
0:21:36
0:28:48
0:36:00
0:43:12
0:50:24
0:57:36
1:04:48
-2.0
-4.0
Time:h:mm:ss
-6.0
Fig. 4.35 Comparison graph for PCM composite material at 75 kph speed
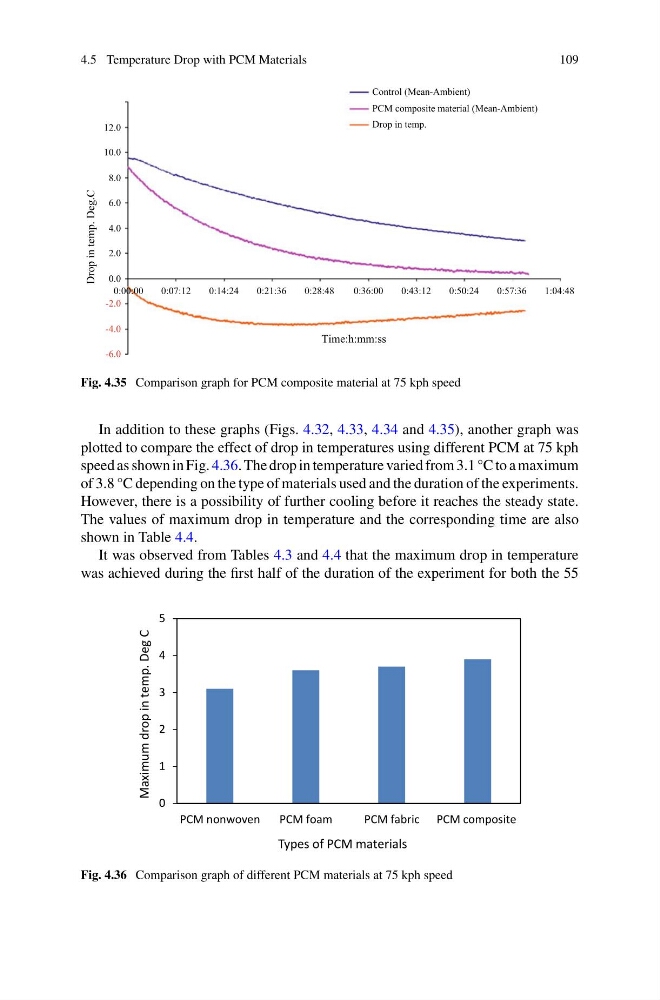
In addition to these graphs (Figs. 4.32, 4.33, 4.34 and 4.35), another graph was
plotted to compare the effect of drop in temperatures using different PCM at 75 kph
speed as shown in Fig. 4.36. The drop in temperature varied from 3.1 °C to a maximum
of 3.8 °C depending on the type of materials used and the duration of the experiments.
However, there is a possibility of further cooling before it reaches the steady state.
The values of maximum drop in temperature and the corresponding time are also
shown in Table 4.4.
It was observed from Tables 4.3 and 4.4 that the maximum drop in temperature
was achieved during the first half of the duration of the experiment for both the 55
0
1
2
3
4
5
PCM nonwoven
PCM foam
PCM fabric PCM composite
Maximum drop in temp. Deg C
Types of PCM materials
Fig. 4.36 Comparison graph of different PCM materials at 75 kph speed
109
Drop in temp. Deg.C
Control (Mean-Ambient)
12.0
PCM composite material (Mean-Ambient)
Drop in temp.
10.0
8.0
6.0
4.0
2.0
0.0
0:00:00
0:07:12
0:14:24
0:21:36
0:28:48
0:36:00
0:43:12
0:50:24
0:57:36
1:04:48
-2.0
-4.0
Time:h:mm:ss
-6.0
Fig. 4.35 Comparison graph for PCM composite material at 75 kph speed
In addition to these graphs (Figs. 4.32, 4.33, 4.34 and 4.35), another graph was
plotted to compare the effect of drop in temperatures using different PCM at 75 kph
speed as shown in Fig. 4.36. The drop in temperature varied from 3.1 °C to a maximum
of 3.8 °C depending on the type of materials used and the duration of the experiments.
However, there is a possibility of further cooling before it reaches the steady state.
The values of maximum drop in temperature and the corresponding time are also
shown in Table 4.4.
It was observed from Tables 4.3 and 4.4 that the maximum drop in temperature
was achieved during the first half of the duration of the experiment for both the 55
0
1
2
3
4
5
PCM nonwoven
PCM foam
PCM fabric PCM composite
Maximum drop in temp. Deg C
Types of PCM materials
Fig. 4.36 Comparison graph of different PCM materials at 75 kph speed