

108
4 Results and Discussion
Drop in temp. Deg.C
12.0
10.0
Control (Mean-Ambient)
PCM foam material (Mean-Ambient)
Drop in temp.
8.0
6.0
4.0
2.0
0.0
0:00:00
0:07:12
0:14:24
0:21:36
0:28:48
0:36:00
0:43:12
0:50:24
0:57:36
1:04:48
-2.0
-4.0
Time:h:mm:ss
-6.0
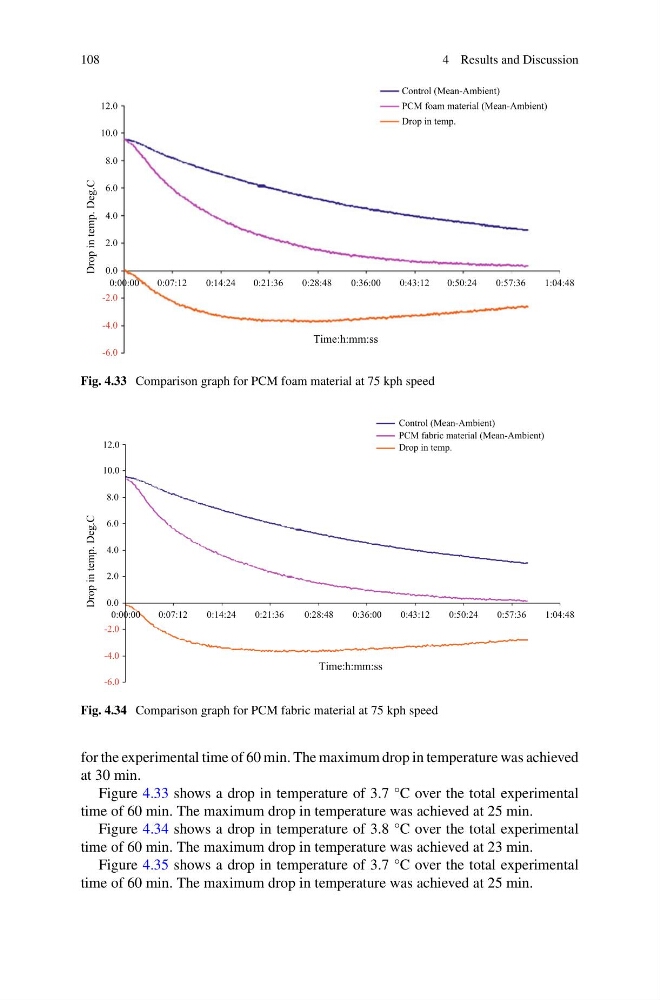
Fig. 4.33 Comparison graph for PCM foam material at 75 kph speed
Drop in temp. Deg.C
12.0
Control (Mean-Ambient)
PCM fabric material (Mean-Ambient)
Drop in temp.
10.0
8.0
6.0
4.0
2.0
0.0
0:00:00
0:07:12
0:14:24
0:21:36
0:28:48
0:36:00
0:43:12
0:50:24
0:57:36
1:04:48
-2.0
-4.0
Time:h:mm:ss
-6.0
Fig. 4.34 Comparison graph for PCM fabric material at 75 kph speed
for the experimental time of 60 min. The maximum drop in temperature was achieved
at 30 min.
Figure 4.33 shows a drop in temperature of 3.7 °C over the total experimental
time of 60 min. The maximum drop in temperature was achieved at 25 min.
Figure 4.34 shows a drop in temperature of 3.8 °C over the total experimental
time of 60 min. The maximum drop in temperature was achieved at 23 min.
Figure 4.35 shows a drop in temperature of 3.7 °C over the total experimental
time of 60 min. The maximum drop in temperature was achieved at 25 min.
4 Results and Discussion
Drop in temp. Deg.C
12.0
10.0
Control (Mean-Ambient)
PCM foam material (Mean-Ambient)
Drop in temp.
8.0
6.0
4.0
2.0
0.0
0:00:00
0:07:12
0:14:24
0:21:36
0:28:48
0:36:00
0:43:12
0:50:24
0:57:36
1:04:48
-2.0
-4.0
Time:h:mm:ss
-6.0
Fig. 4.33 Comparison graph for PCM foam material at 75 kph speed
Drop in temp. Deg.C
12.0
Control (Mean-Ambient)
PCM fabric material (Mean-Ambient)
Drop in temp.
10.0
8.0
6.0
4.0
2.0
0.0
0:00:00
0:07:12
0:14:24
0:21:36
0:28:48
0:36:00
0:43:12
0:50:24
0:57:36
1:04:48
-2.0
-4.0
Time:h:mm:ss
-6.0
Fig. 4.34 Comparison graph for PCM fabric material at 75 kph speed
for the experimental time of 60 min. The maximum drop in temperature was achieved
at 30 min.
Figure 4.33 shows a drop in temperature of 3.7 °C over the total experimental
time of 60 min. The maximum drop in temperature was achieved at 25 min.
Figure 4.34 shows a drop in temperature of 3.8 °C over the total experimental
time of 60 min. The maximum drop in temperature was achieved at 23 min.
Figure 4.35 shows a drop in temperature of 3.7 °C over the total experimental
time of 60 min. The maximum drop in temperature was achieved at 25 min.