

Hydrogen
255
TABLe 9.4
Comparison of Energy Content of Various Fuels
Fuel
Chemical
Formula
State
Energy
(MJ/kg)
Gasoline
C 5–10 H 12–22
Liquid
47.4
LPG
C 3–4 H 8–10
Liquid
48.8
LNG
CH 4
Liquid
~50.0
Methanol
CH 3 OH
Liquid
22.3
Ethanol
C 2 H 5 OH
Liquid
29.9
Liquid hydrogen
H 2
Liquid
141.9
Hydrogen
H 2
Gaseous
141.9
Natural gas
CH 4
Gaseous
~50.0
Energy
(gJ/m 3 )
34.85
24.4
~230.0
18.10
23.60
10.10
0.013
0.040
Source: From Das, L. M., International Journal of Hydrogen Energy, 21, 789–800,
1996. Reprinted with permission from the International Association
of Hydrogen Energy and Elsevier Publications.
removing stress concentration, additives to hydrogen, selection of alloy
materials, and so on. The internal and environmental hydrogen embrittlement maximizes in the temperature range of between –73 and 27ºC whereas
hydrogen reaction embrittlement occurs at temperatures above room temperature (Rigas and Sklavounos 2009).
9.4.3.9 Calorific Value
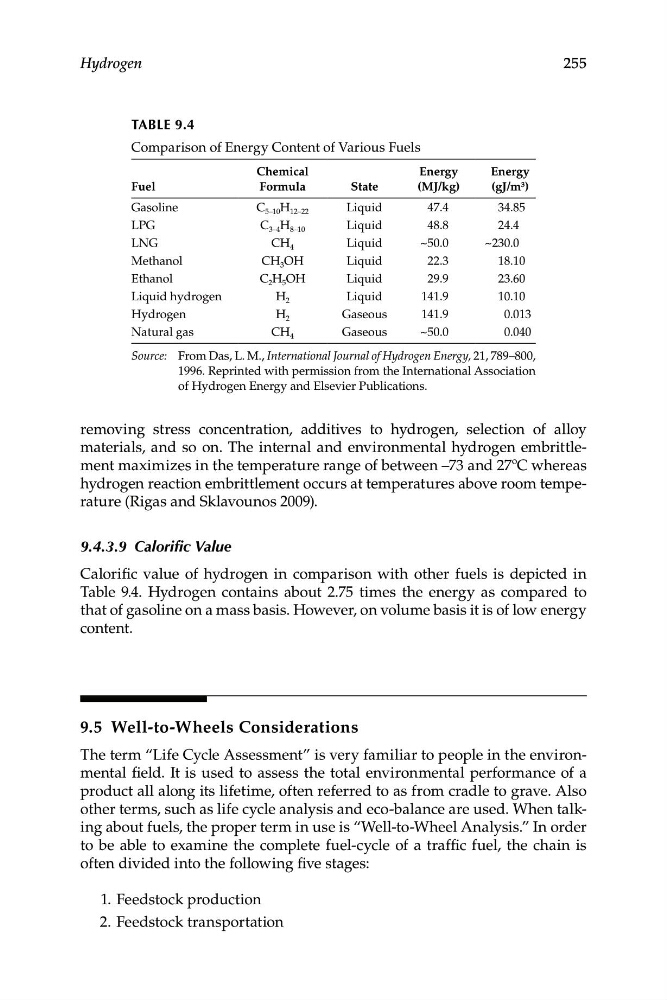
Calorific value of hydrogen in comparison with other fuels is depicted in
Table 9.4. Hydrogen contains about 2.75 times the energy as compared to
that of gasoline on a mass basis. However, on volume basis it is of low energy
content.
9.5 Well-to-Wheels Considerations
The term “Life Cycle Assessment” is very familiar to people in the environmental field. It is used to assess the total environmental performance of a
product all along its lifetime, often referred to as from cradle to grave. Also
other terms, such as life cycle analysis and eco-balance are used. When talking about fuels, the proper term in use is “Well-to-Wheel Analysis.” In order
to be able to examine the complete fuel-cycle of a traffic fuel, the chain is
often divided into the following five stages:
1. Feedstock production
2. Feedstock transportation
255
TABLe 9.4
Comparison of Energy Content of Various Fuels
Fuel
Chemical
Formula
State
Energy
(MJ/kg)
Gasoline
C 5–10 H 12–22
Liquid
47.4
LPG
C 3–4 H 8–10
Liquid
48.8
LNG
CH 4
Liquid
~50.0
Methanol
CH 3 OH
Liquid
22.3
Ethanol
C 2 H 5 OH
Liquid
29.9
Liquid hydrogen
H 2
Liquid
141.9
Hydrogen
H 2
Gaseous
141.9
Natural gas
CH 4
Gaseous
~50.0
Energy
(gJ/m 3 )
34.85
24.4
~230.0
18.10
23.60
10.10
0.013
0.040
Source: From Das, L. M., International Journal of Hydrogen Energy, 21, 789–800,
1996. Reprinted with permission from the International Association
of Hydrogen Energy and Elsevier Publications.
removing stress concentration, additives to hydrogen, selection of alloy
materials, and so on. The internal and environmental hydrogen embrittlement maximizes in the temperature range of between –73 and 27ºC whereas
hydrogen reaction embrittlement occurs at temperatures above room temperature (Rigas and Sklavounos 2009).
9.4.3.9 Calorific Value
Calorific value of hydrogen in comparison with other fuels is depicted in
Table 9.4. Hydrogen contains about 2.75 times the energy as compared to
that of gasoline on a mass basis. However, on volume basis it is of low energy
content.
9.5 Well-to-Wheels Considerations
The term “Life Cycle Assessment” is very familiar to people in the environmental field. It is used to assess the total environmental performance of a
product all along its lifetime, often referred to as from cradle to grave. Also
other terms, such as life cycle analysis and eco-balance are used. When talking about fuels, the proper term in use is “Well-to-Wheel Analysis.” In order
to be able to examine the complete fuel-cycle of a traffic fuel, the chain is
often divided into the following five stages:
1. Feedstock production
2. Feedstock transportation